21 Appendix C — Product Analysis Detail
21.1 C.1 · Whole-Business Combined View
This appendix consolidates product analysis across all three segments: top products by revenue, volume, and revenue per unit; segment-exclusive products; and the combined purchasing reference.
Net revenue in these tables is gross invoiced less cancellations. A product appearing in the gross top 10 but absent from the net top 10 is overstating its commercial contribution — the gap between the two lists identifies where cancellations are concentrated by product. The risk signal column flags single-account dependency: products where one account’s purchasing dominates that product’s total revenue.
21.1.1 Combined Purchasing View — Segment Attribution
UK and International customers purchase largely different products at different frequencies. Only one of the top 10 products by segment overlaps across both. A combined view is useful for aggregate stock planning, but the segment-level divergence is the acquisition-relevant finding — it is the data basis for separate UK and International commercial teams.
This table synthesizes the three segment forecasts into a single purchasing reference. Every figure is a projected demand signal, not a confirmed order quantity. No number should be used for purchasing without checking current inventory positions and applying the product’s historical cancellation rate to convert gross projections into net fulfillment quantities.
Four products — Paper Chain Kit 50’s Christmas, Rabbit Night Light, Assorted Colour Bird Ornament, and Chilli Lights — have documented probable stockout periods identified in the demand gap analysis later in this section. When a product is out of stock, the orders that would have been placed do not appear in the data, and the projection model cannot capture demand that was never recorded. Treat these four projections as floor estimates.
| Product | UK Units | Intl Units | Total 4-Wk | Demand Confidence |
|---|---|---|---|---|
| Small Popcorn Holder | 12236 | 0 | 12236 | HIGH — identified-customer-driven |
| Rabbit Night Light | 0 | 5416 | 5416 | HIGH — identified-customer-driven |
| Paper Chain Kit 50'S Chri... | 5386 | 0 | 5386 | HIGH — identified-customer-driven |
| Jumbo Bag Red Retrospot | 4140 | 0 | 4140 | HIGH — identified-customer-driven |
| Assorted Colour Bird Orna... | 3568 | 0 | 3568 | HIGH — identified-customer-driven |
| Black Record Cover Frame | 2632 | 0 | 2632 | HIGH — identified-customer-driven |
| White Hanging Heart T-Lig... | 2376 | 0 | 2376 | HIGH — identified-customer-driven |
| Chilli Lights | 1412 | 0 | 1412 | HIGH — identified-customer-driven |
| Regency Cakestand 3 Tier | 576 | 260 | 836 | HIGH — identified-customer-driven |
| Spaceboy Lunch Box | 0 | 652 | 652 | HIGH — identified-customer-driven |
| Party Bunting | 620 | 0 | 620 | HIGH — identified-customer-driven |
| Red Toadstool Led Night L... | 0 | 580 | 580 | HIGH — identified-customer-driven |
| Round Snack Boxes Set Of4... | 0 | 568 | 568 | HIGH — identified-customer-driven |
| Dolly Girl Lunch Box | 0 | 528 | 528 | HIGH — identified-customer-driven |
| Plasters In Tin Woodland ... | 0 | 468 | 468 | HIGH — identified-customer-driven |
| Pink 3 Piece Polkadot Cut... | 0 | 304 | 304 | HIGH — identified-customer-driven |
| Set Of 3 Regency Cake Tins | 0 | 264 | 264 | HIGH — identified-customer-driven |
| Round Snack Boxes Set Of ... | 0 | 240 | 240 | HIGH — identified-customer-driven |
HIGH confidence products are driven by identified repeat customers — these are the lowest-risk stock commitments. MEDIUM confidence products require triangulation against actual inventory records before committing. LOW confidence projections, where 60% or more of projected demand is anonymous-driven, should be treated as indicative only.
The unit figures are gross 4-week demand projections representing expected orders, not retained revenue. Each product’s historical cancellation rate should be applied when converting forecast units into fulfillment quantities. A product with a 6% cancellation rate requires approximately 6.4% additional stock — divide projected demand by one minus the cancellation rate to size the order correctly.
Post-close action. Buyer’s Supply Chain team and COO. Stock confirmations on the four floor-estimate products before the first Q4 under new ownership. All other top-demand products confirmed within Quarter 1 (Days 1–90).
Organizational implication. The demand table shows two largely non-overlapping product portfolios currently managed by the same team. UK customers concentrate in home décor and gift sets. International customers concentrate in different SKUs with higher per-unit values and longer reorder intervals. A single account management team optimizing for UK demand cadence will systematically under-serve international reorder patterns. This is a structural mismatch between how each segment buys, not a staffing volume problem. The post-close recommendation for dedicated UK and International account management mandates in Segment Programs is grounded in this data.
21.1.2 Probable Demand Gaps — Estimating the Cost of Lost Demand
Were there periods where key products appear to have gone out of stock, and what did those probable stockouts cost?
This analysis works backward from the demand signal. All figures require validation against actual inventory records before being used for financial planning.
Products flagged here show consecutive near-zero weeks following sustained positive demand — the signature of a probable stockout.
Combined annualized exposure across these 5 products: approximately £214.92K — this is the upper bound of recoverable revenue from resolving the stockout pattern on these SKUs. As a share of total business revenue: approximately 2.09%.
Stockout history is an inventory liability assessment tool. First, probable stockout events quantify lost revenue under current management — approximately £214.92K annualized across these products — that would be recoverable under better inventory management. Second, they reveal the demand signal beneath the actual sales data: a product with probable stockout weeks has higher underlying demand than its sales figures show. Pre-close, the acquirer should request inventory records for the flagged products to validate whether the stockout pattern reflects a systematic purchasing failure or a one-time supply disruption.
21.2 C.2 · UK Product Analysis
UK-segment product detail.
21.2.1 What the UK Product Data Tells an Acquirer
Before reviewing individual products, the data establishes three specific commercial gaps — things the current business is not doing that a competent acquirer can capitalize on immediately post-close.
ImportantThree Acquisition Value Creation Levers — UK Segment Products
Lever 1 — Convert the one-timer pool. 1,352 UK Identified accounts — 34.54% of the entire UK base — placed exactly one order and never returned. The unrecovered incremental forward value from these accounts is approximately £1.35M — computed as the number of one-time accounts × (3-year LTV minus the median revenue already received on their first order). This is not an inevitable loss. On the transaction record, there is no evidence of a systematic day-30 follow-up trigger for new accounts. An acquirer who implements this program within 30 days of close begins recovering this value immediately. Approximately 3 new UK accounts enter and exit the 30-day conversion window every day without a follow-up — each one permanently lost at the UK forward LTV.
Lever 2 — Reactivate the 687 accounts that went silent before Q4. These accounts ordered in H1 2011 and placed zero orders in H2 — the half of the year that includes Q4, the business’s highest-revenue period. Their combined H1 revenue was £353.80K. None of that transferred to H2. For an acquirer, a reactivation call to these accounts serves two purposes: it attempts to restart the commercial relationship and introduces the change in ownership. Accounts that lapsed due to service or relationship issues with the prior team may respond differently to new ownership. Zero acquisition cost. Full forward LTV if reactivated.
Lever 3 — Protect the 6 UK-exclusive top products through named account ownership. Of the top 10 UK products by net revenue, 6 have no demand buffer from international or anonymous customers. If the UK accounts driving those products reduce orders or churn, no other segment absorbs the shortfall. For an acquirer, these are the products most vulnerable to account concentration risk — losing one or two key accounts can remove a meaningful share of the product’s UK revenue with no offsetting demand elsewhere in the portfolio.
UK product segment — commercial-potential assessment. The UK product base is not earning at its potential. The one-timer gap, the H1-silent accounts, and the unprotected UK-exclusive products are three documented gaps between current and achievable performance — each addressable within 90 days of close.
21.2.2 UK Accounts That Went Silent Before Q4 (687) — Action Required Now
H1 = January–June 2011. H2 = July–December 2011 (includes Q4, the peak revenue period). Every account in the table below was an active UK customer in H1 and placed zero orders in H2. These are not low-value one-timers. These are established relationships that went silent. Combined H1 revenue: £353,800. None of that revenue transferred to H2. The grouped view by frequency tier is shown below.
| Tier | Account Count | Combined H1 Revenue |
|---|---|---|
| Regular (4–9) | 14 | £16.34K |
| Occasional (2–3) | 163 | £185.30K |
| One-timer (1) | 510 | £151.58K |
21.2.3 Top 10 UK Products by Net Revenue
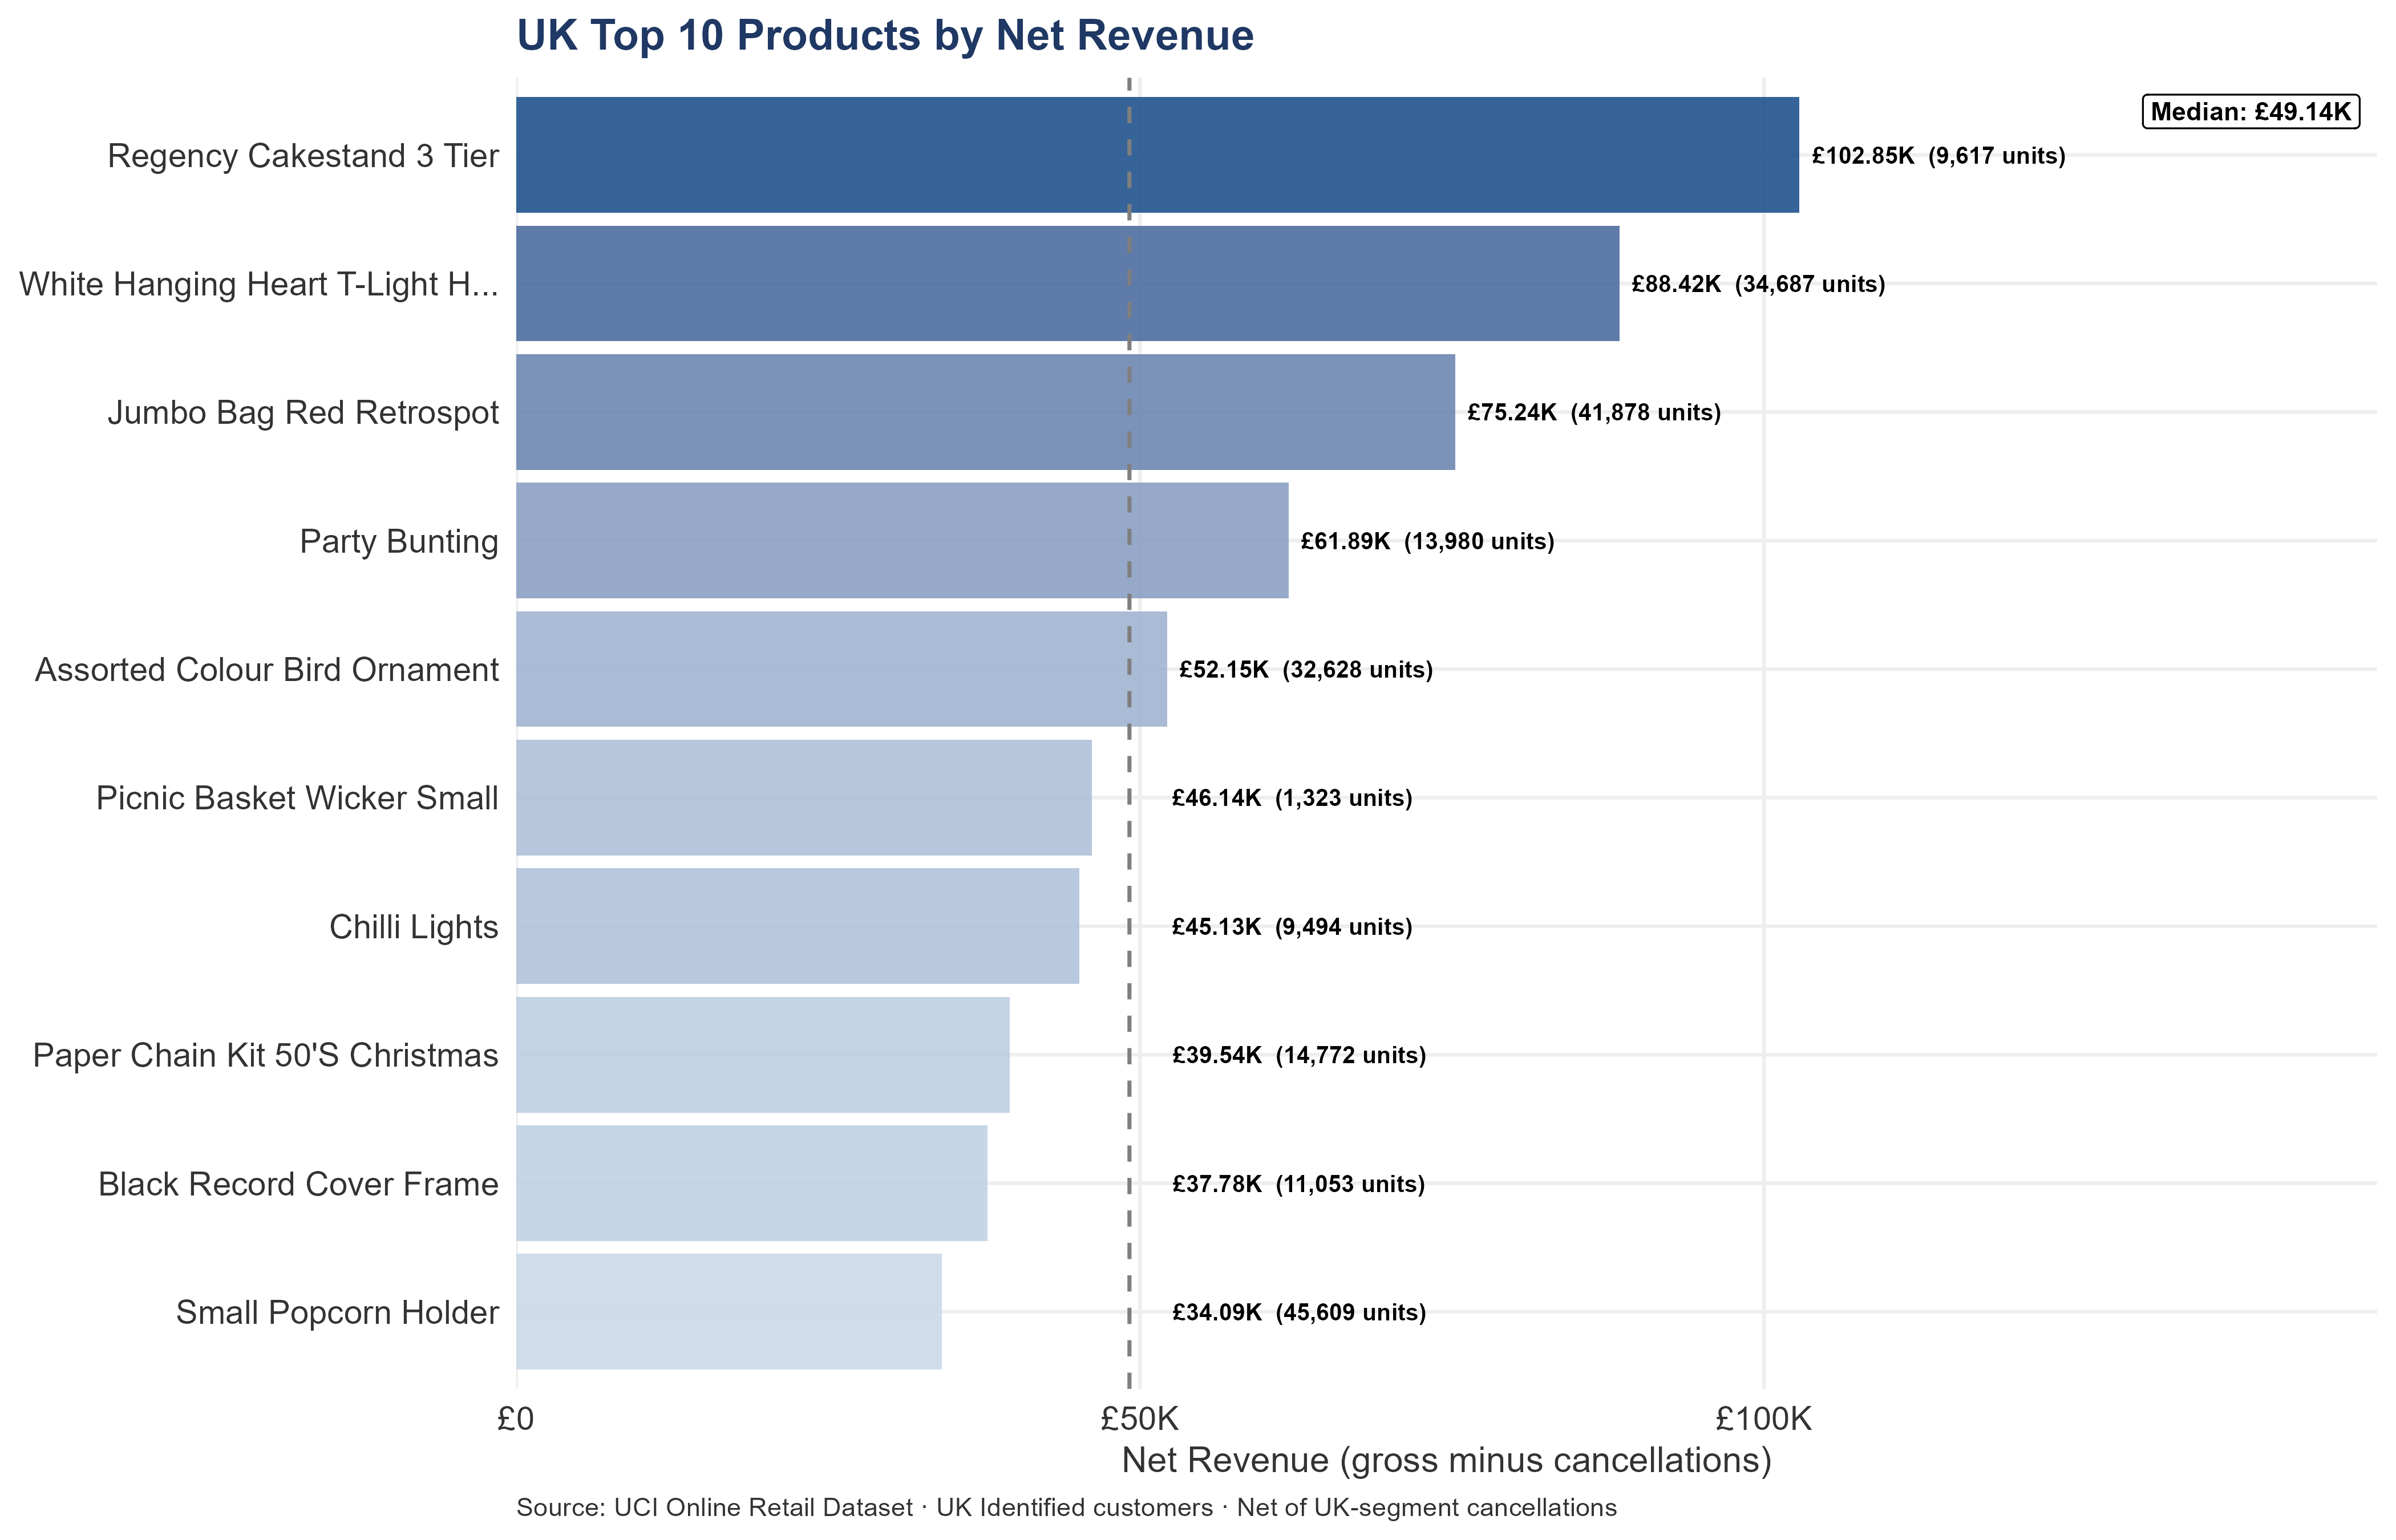
Which products generate the most revenue from UK Identified customers, after cancellations?
Net revenue is gross invoiced minus cancellations. A product appearing in the gross top 10 but not the net top 10 is overstating its commercial contribution. Every decision that uses gross figures — stock prioritization, Q4 purchasing, supplier negotiations — is working from inflated numbers.
UK segment only — cancellation figures reflect UK-segment reversals; whole-business figures in Cancellations & Pricing.
| Rank | Product | Stock Code | Gross Revenue | Cancellations | Net Revenue | Cancel Rate | Units Sold | Rev / Unit |
|---|---|---|---|---|---|---|---|---|
| 1 | Regency Cakestand 3 Tier | 22423 | £110.71K | £7.87K | £102.85K | 7.11% | 9,617 | £10.69 |
| 2 | White Hanging Heart T-Light H... | 85123A | £94.96K | £6.54K | £88.42K | 6.89% | 34,687 | £2.55 |
| 3 | Jumbo Bag Red Retrospot | 85099B | £77.19K | £1.96K | £75.24K | 2.53% | 41,878 | £1.80 |
| 4 | Party Bunting | 47566 | £63.05K | £1.16K | £61.89K | 1.83% | 13,980 | £4.43 |
| 5 | Assorted Colour Bird Ornament | 84879 | £52.23K | £81 | £52.15K | 0.16% | 32,628 | £1.60 |
| 6 | Picnic Basket Wicker Small | 22502 | £46.52K | £380 | £46.14K | 0.82% | 1,323 | £34.88 |
| 7 | Chilli Lights | 79321 | £45.48K | £350 | £45.13K | 0.77% | 9,494 | £4.75 |
| 8 | Paper Chain Kit 50'S Christmas | 22086 | £40.39K | £854 | £39.54K | 2.12% | 14,772 | £2.68 |
| 9 | Black Record Cover Frame | 21137 | £37.84K | £55 | £37.78K | 0.15% | 11,053 | £3.42 |
| 10 | Small Popcorn Holder | 22197 | £34.41K | £319 | £34.09K | 0.93% | 45,609 | £0.75 |
The top 10 UK products combined generate roughly 8% of total UK segment revenue — meaning 10 products out of 3,639 active UK SKUs account for 1 in 12 pounds of UK revenue. Inventory due diligence concentrates on these 10 products.
The top 10 are not a uniform group. Regency Cakestand 3 Tier (low volume, high unit value, highest cancel rate in the top 10) is an occasional-purchase product warranting investigation before Q4. White Hanging Heart T-Light Holder (high volume, moderate unit value, second-highest cancel rate, UK-exclusive) is a frequent-replenishment product where customer relationships are exposed if the cancel rate reflects service quality issues. Jumbo Bag Red Retrospot and Assorted Colour Bird Ornament are staple products with negligible cancel rates — the most reliable revenue products in the top 10. Picnic Basket Wicker Small is an extreme outlier on revenue per unit, almost certainly reflecting a unit-of-measure inconsistency; Account 15098 drives 0.00% of this product’s UK revenue and is also in the H1-silent table.
For inventory valuation, an acquirer pricing UK inventory should (1) exclude Picnic Basket Wicker until the unit-of-measure issue is resolved, (2) apply cancellation discounts to Regency Cakestand and White Hanging Heart gross figures, (3) treat Jumbo Bag Red Retrospot and Assorted Colour Bird Ornament as the most reliable inventory valuation inputs.
21.2.4 Top 10 UK Products by Unit Volume
Which products move the most units through the UK customer base?
Understanding the relationship between unit volume and revenue reveals which products serve different commercial functions in the UK catalog.
Volume leaders are not always revenue leaders. A product that moves large quantities at low unit price may be commercially important for customer relationship depth — frequent replenishment orders create natural touchpoints — even if its revenue contribution is modest. Volume products also carry different stock risk: a stockout on a high-volume product disrupts more orders per week than a stockout on a high-value low-volume product.
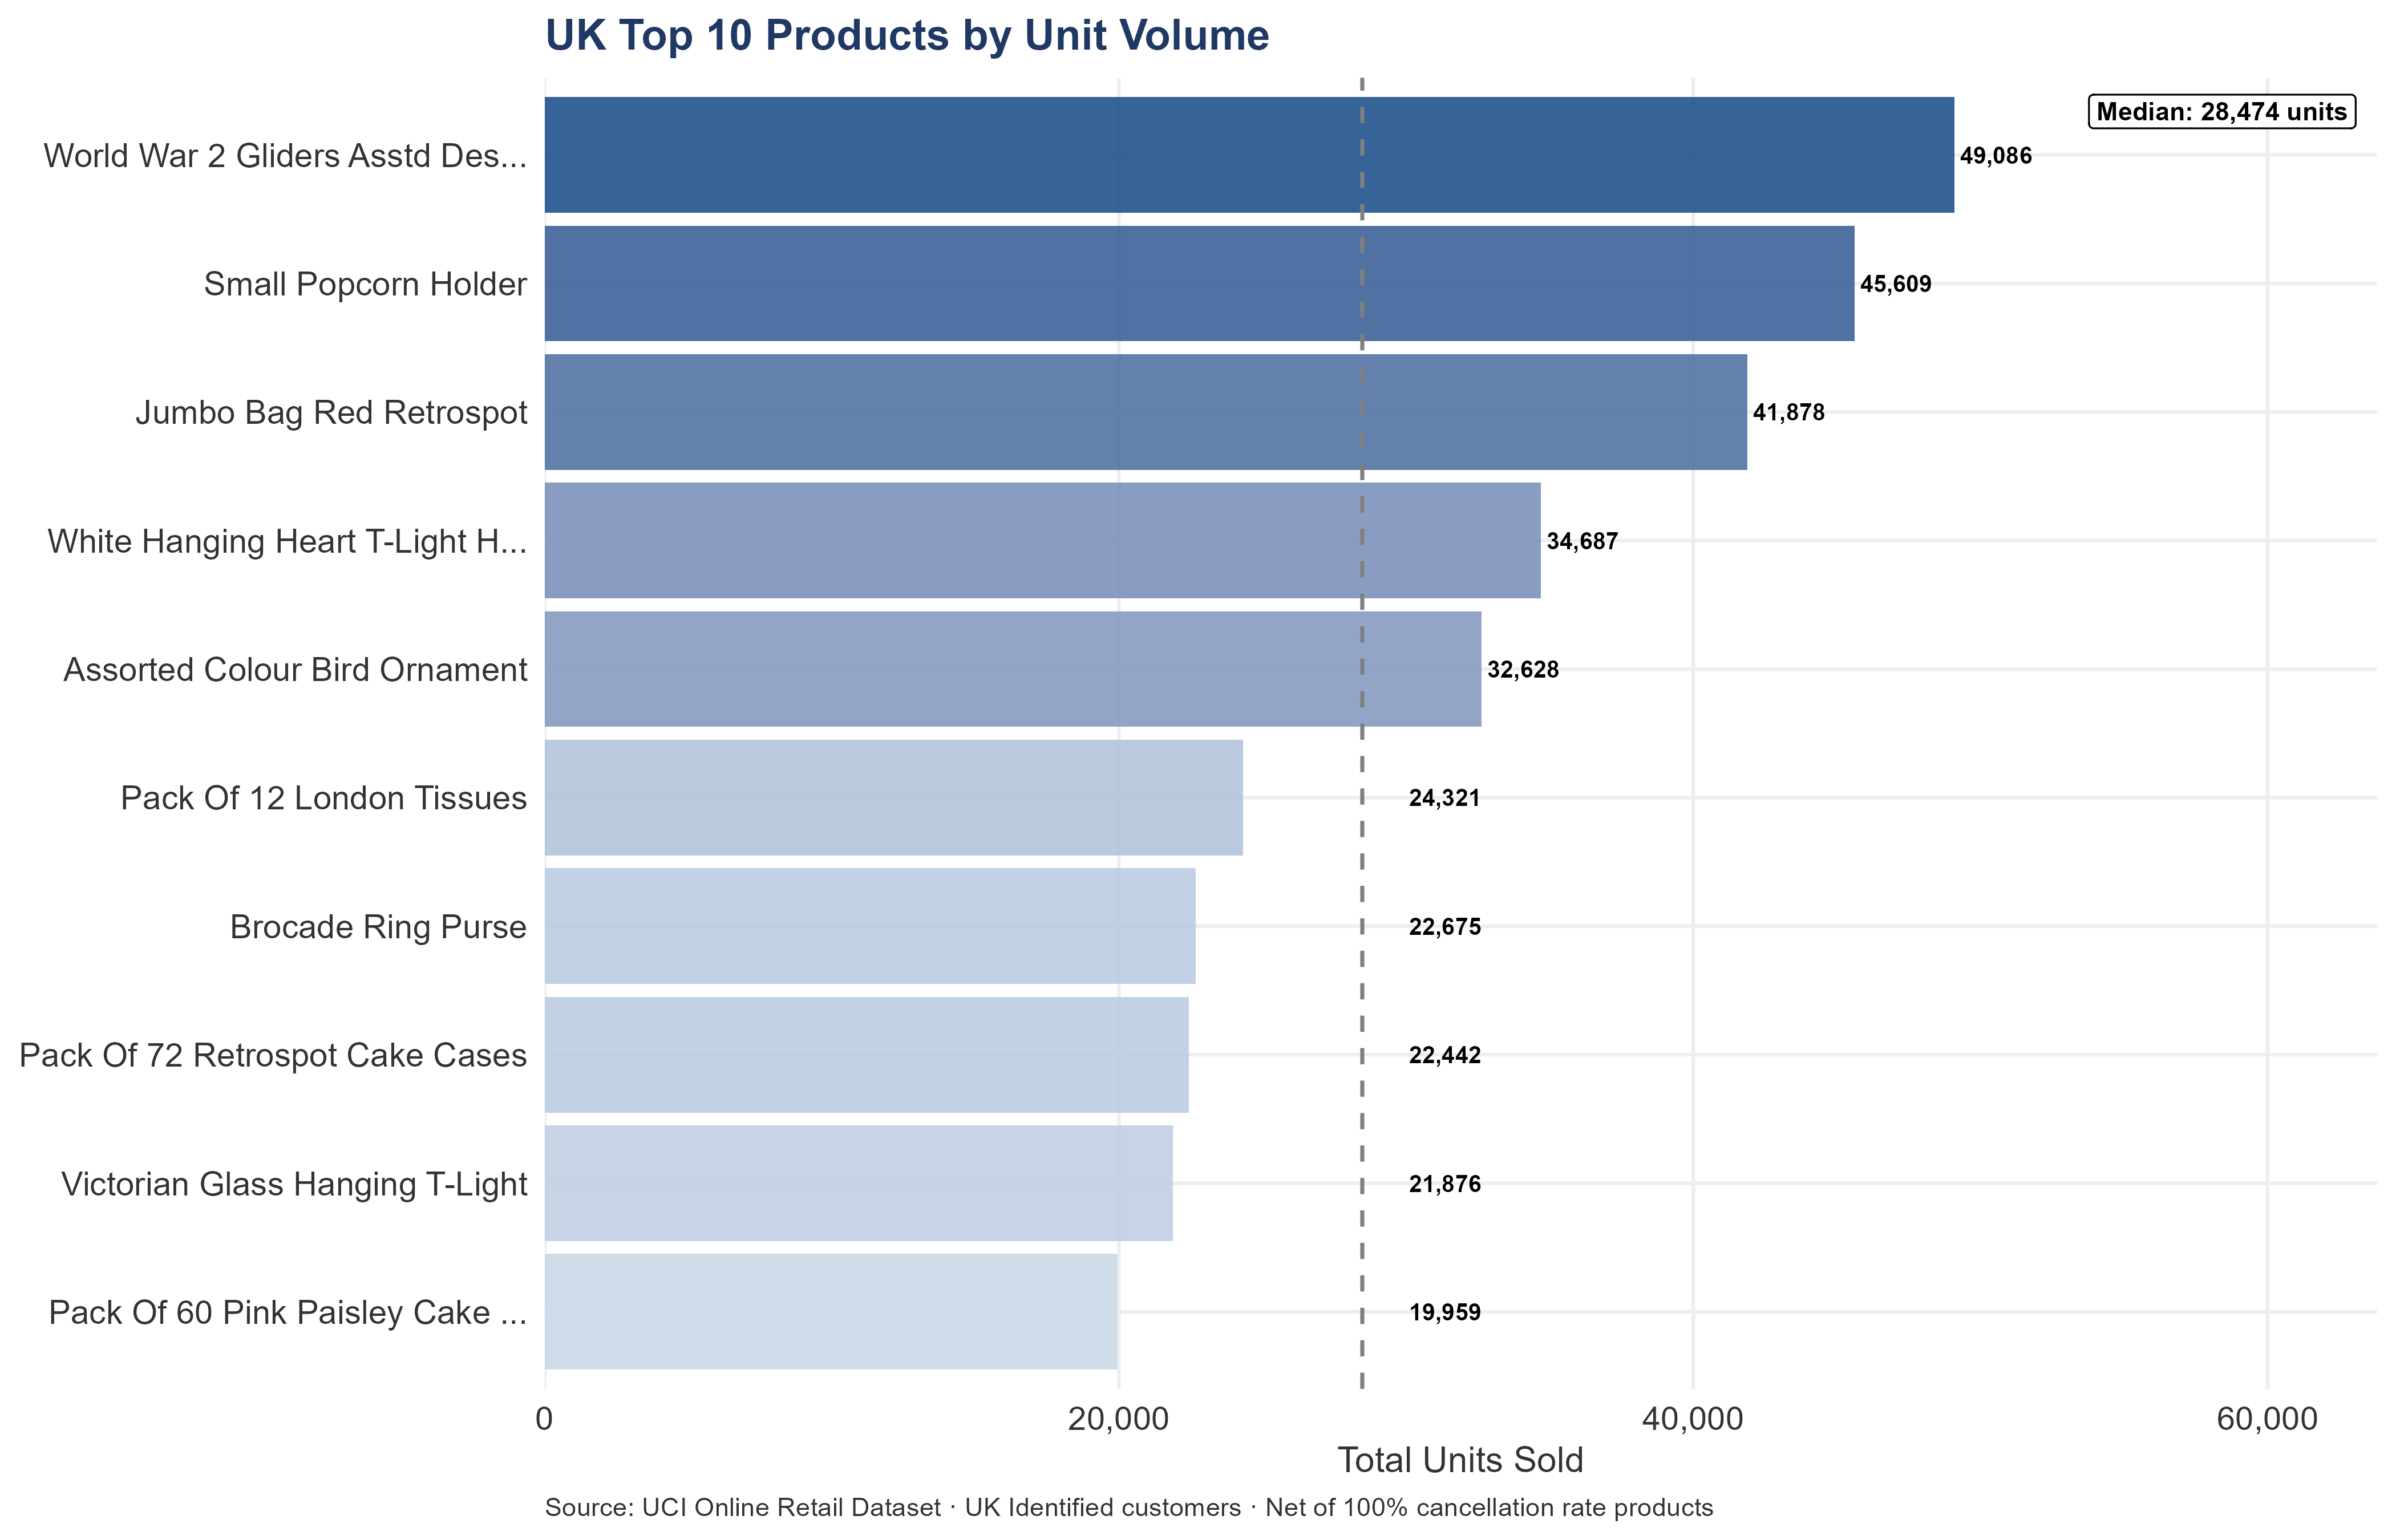
Volume leaders that also appear in the revenue top 10 are simultaneously high-frequency and high-value — the most commercially productive combination. Volume-only products (high frequency, low unit price) are relationship anchors: customers who order them every few weeks are active relationships even if revenue contribution is modest. Cross-sell opportunity: every account that buys a volume-only product is a candidate to be introduced to a top revenue product. Pre-close, an acquirer should verify current inventory levels for the top-5 volume products against the Q4 demand forecast.
21.2.5 Top 10 UK Products by Revenue per Unit
Which products deliver the highest revenue per unit sold?
The revenue-per-unit ranking complements the volume and total-revenue views by isolating the products where each individual transaction carries the greatest commercial weight.
Revenue per unit identifies products where each individual sale carries the most commercial weight. These are the products where a pricing inconsistency, a discount, or a stockout has the highest per-transaction cost. The floor for inclusion is 50 units sold — products with fewer transactions than that have insufficient price observations to produce a reliable average.
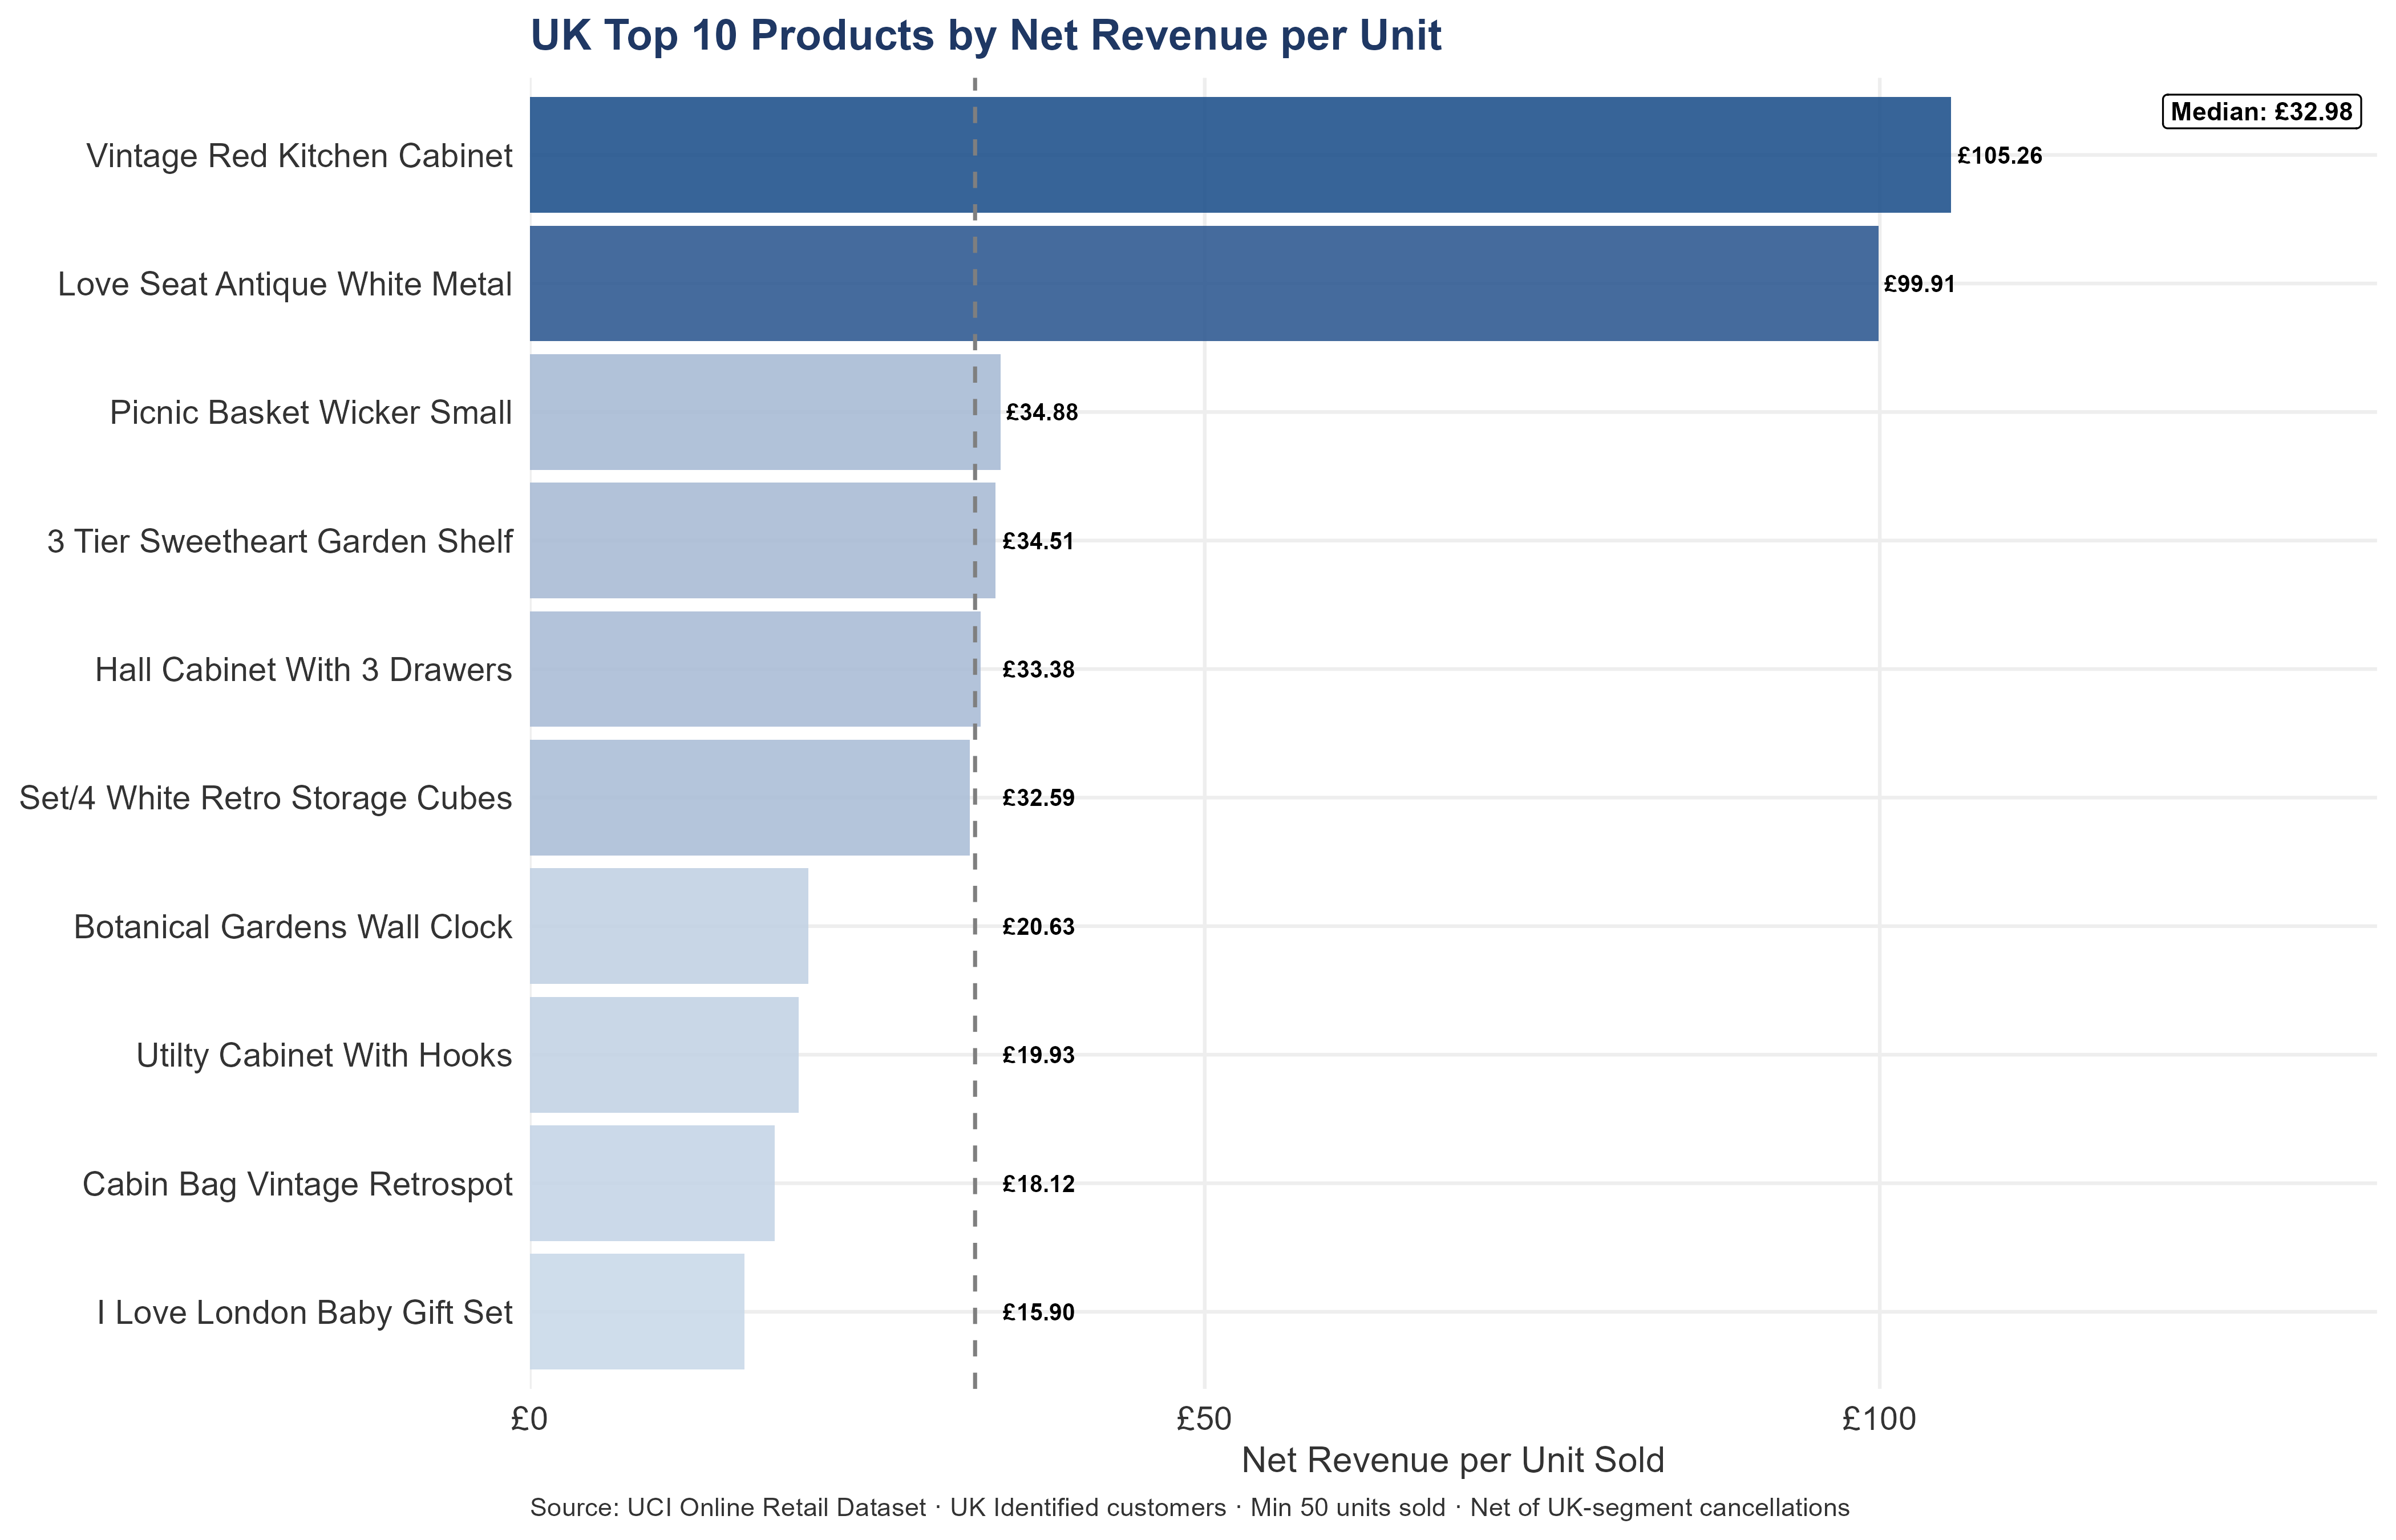
A product with high revenue per unit and consistent pricing has a defensible price point that customers accept without negotiation. A product with high revenue per unit but high price variance has a pricing governance problem: some customers are paying full price and others are getting discounts that erode margin. The Picnic Basket Wicker UOM anomaly distorts the chart — that product’s revenue-per-unit figure is not comparable to the rest of the chart and should not be used for pricing benchmarking until the unit definition is verified in the inventory system. After excluding the UOM anomaly, the top RPU products are the ones where pricing discipline matters most: a 10% discount on a £10/unit product costs the business 10× more per unit than the same discount on a £1/unit product.
21.2.6 UK-Exclusive Products
Which top UK products do not appear in the international or anonymous top 10?
A product that ranks in the UK top 10 but not in the international or anonymous top 10 is driven primarily by UK customer demand. These products have a concentrated UK dependency: the revenue they generate is not diversified across segments. A supply disruption, a single large cancellation, or the loss of one or two major UK accounts directly impacts these products with no offsetting demand from other channels.
Of the top 10 UK products, 6 have no demand buffer from international or anonymous customers.
| UK Rank | Product | Stock Code | Net Revenue | Units Sold | Cancel Rate |
|---|---|---|---|---|---|
| 2 | White Hanging Heart T-Light H… | 85123A | £88.42K | 34,687 | 6.89% |
| 3 | Jumbo Bag Red Retrospot | 85099B | £75.24K | 41,878 | 2.53% |
| 5 | Assorted Colour Bird Ornament | 84879 | £52.15K | 32,628 | 0.16% |
| 6 | Picnic Basket Wicker Small | 22502 | £46.14K | 1,323 | 0.82% |
| 7 | Chilli Lights | 79321 | £45.13K | 9,494 | 0.77% |
| 9 | Black Record Cover Frame | 21137 | £37.78K | 11,053 | 0.15% |
Account concentration behind each UK-exclusive product: A product where the top 3 accounts represent 80%+ of demand is not a product risk — it is an account risk dressed as a product. Losing one of those accounts doesn’t just hurt revenue; it collapses demand for the entire product line.
| UK Rank | Product | Total Net Rev | # UK Accounts | Top Account | Top Acct Rev | Top 1 Share | Top 3 Share | Risk Signal |
|---|---|---|---|---|---|---|---|---|
| 2 | White Hanging Heart T-Light… | £94.96K | 821 | 17450 | £13.25K | 13.96% | 30.11% | 🟢 Distributed demand |
| 3 | Jumbo Bag Red Retrospot | £77.19K | 562 | 15769 | £8.33K | 10.79% | 20.98% | 🟢 Distributed demand |
| 5 | Assorted Colour Bird Ornament | £52.23K | 642 | 12931 | £7.32K | 14.01% | 20.25% | 🟢 Distributed demand |
| 6 | Picnic Basket Wicker Small | £46.52K | 167 | 15098 | £39.92K | 85.80% | 87.68% | 🔴 Single-account dependency |
| 7 | Chilli Lights | £45.48K | 200 | 16532 | £6.37K | 14.01% | 36.02% | 🟢 Distributed demand |
| 9 | Black Record Cover Frame | £37.84K | 130 | 16210 | £16.03K | 42.36% | 57.09% | 🟡 Moderate concentration |
21.2.7 Product Affinity — UK Top 10
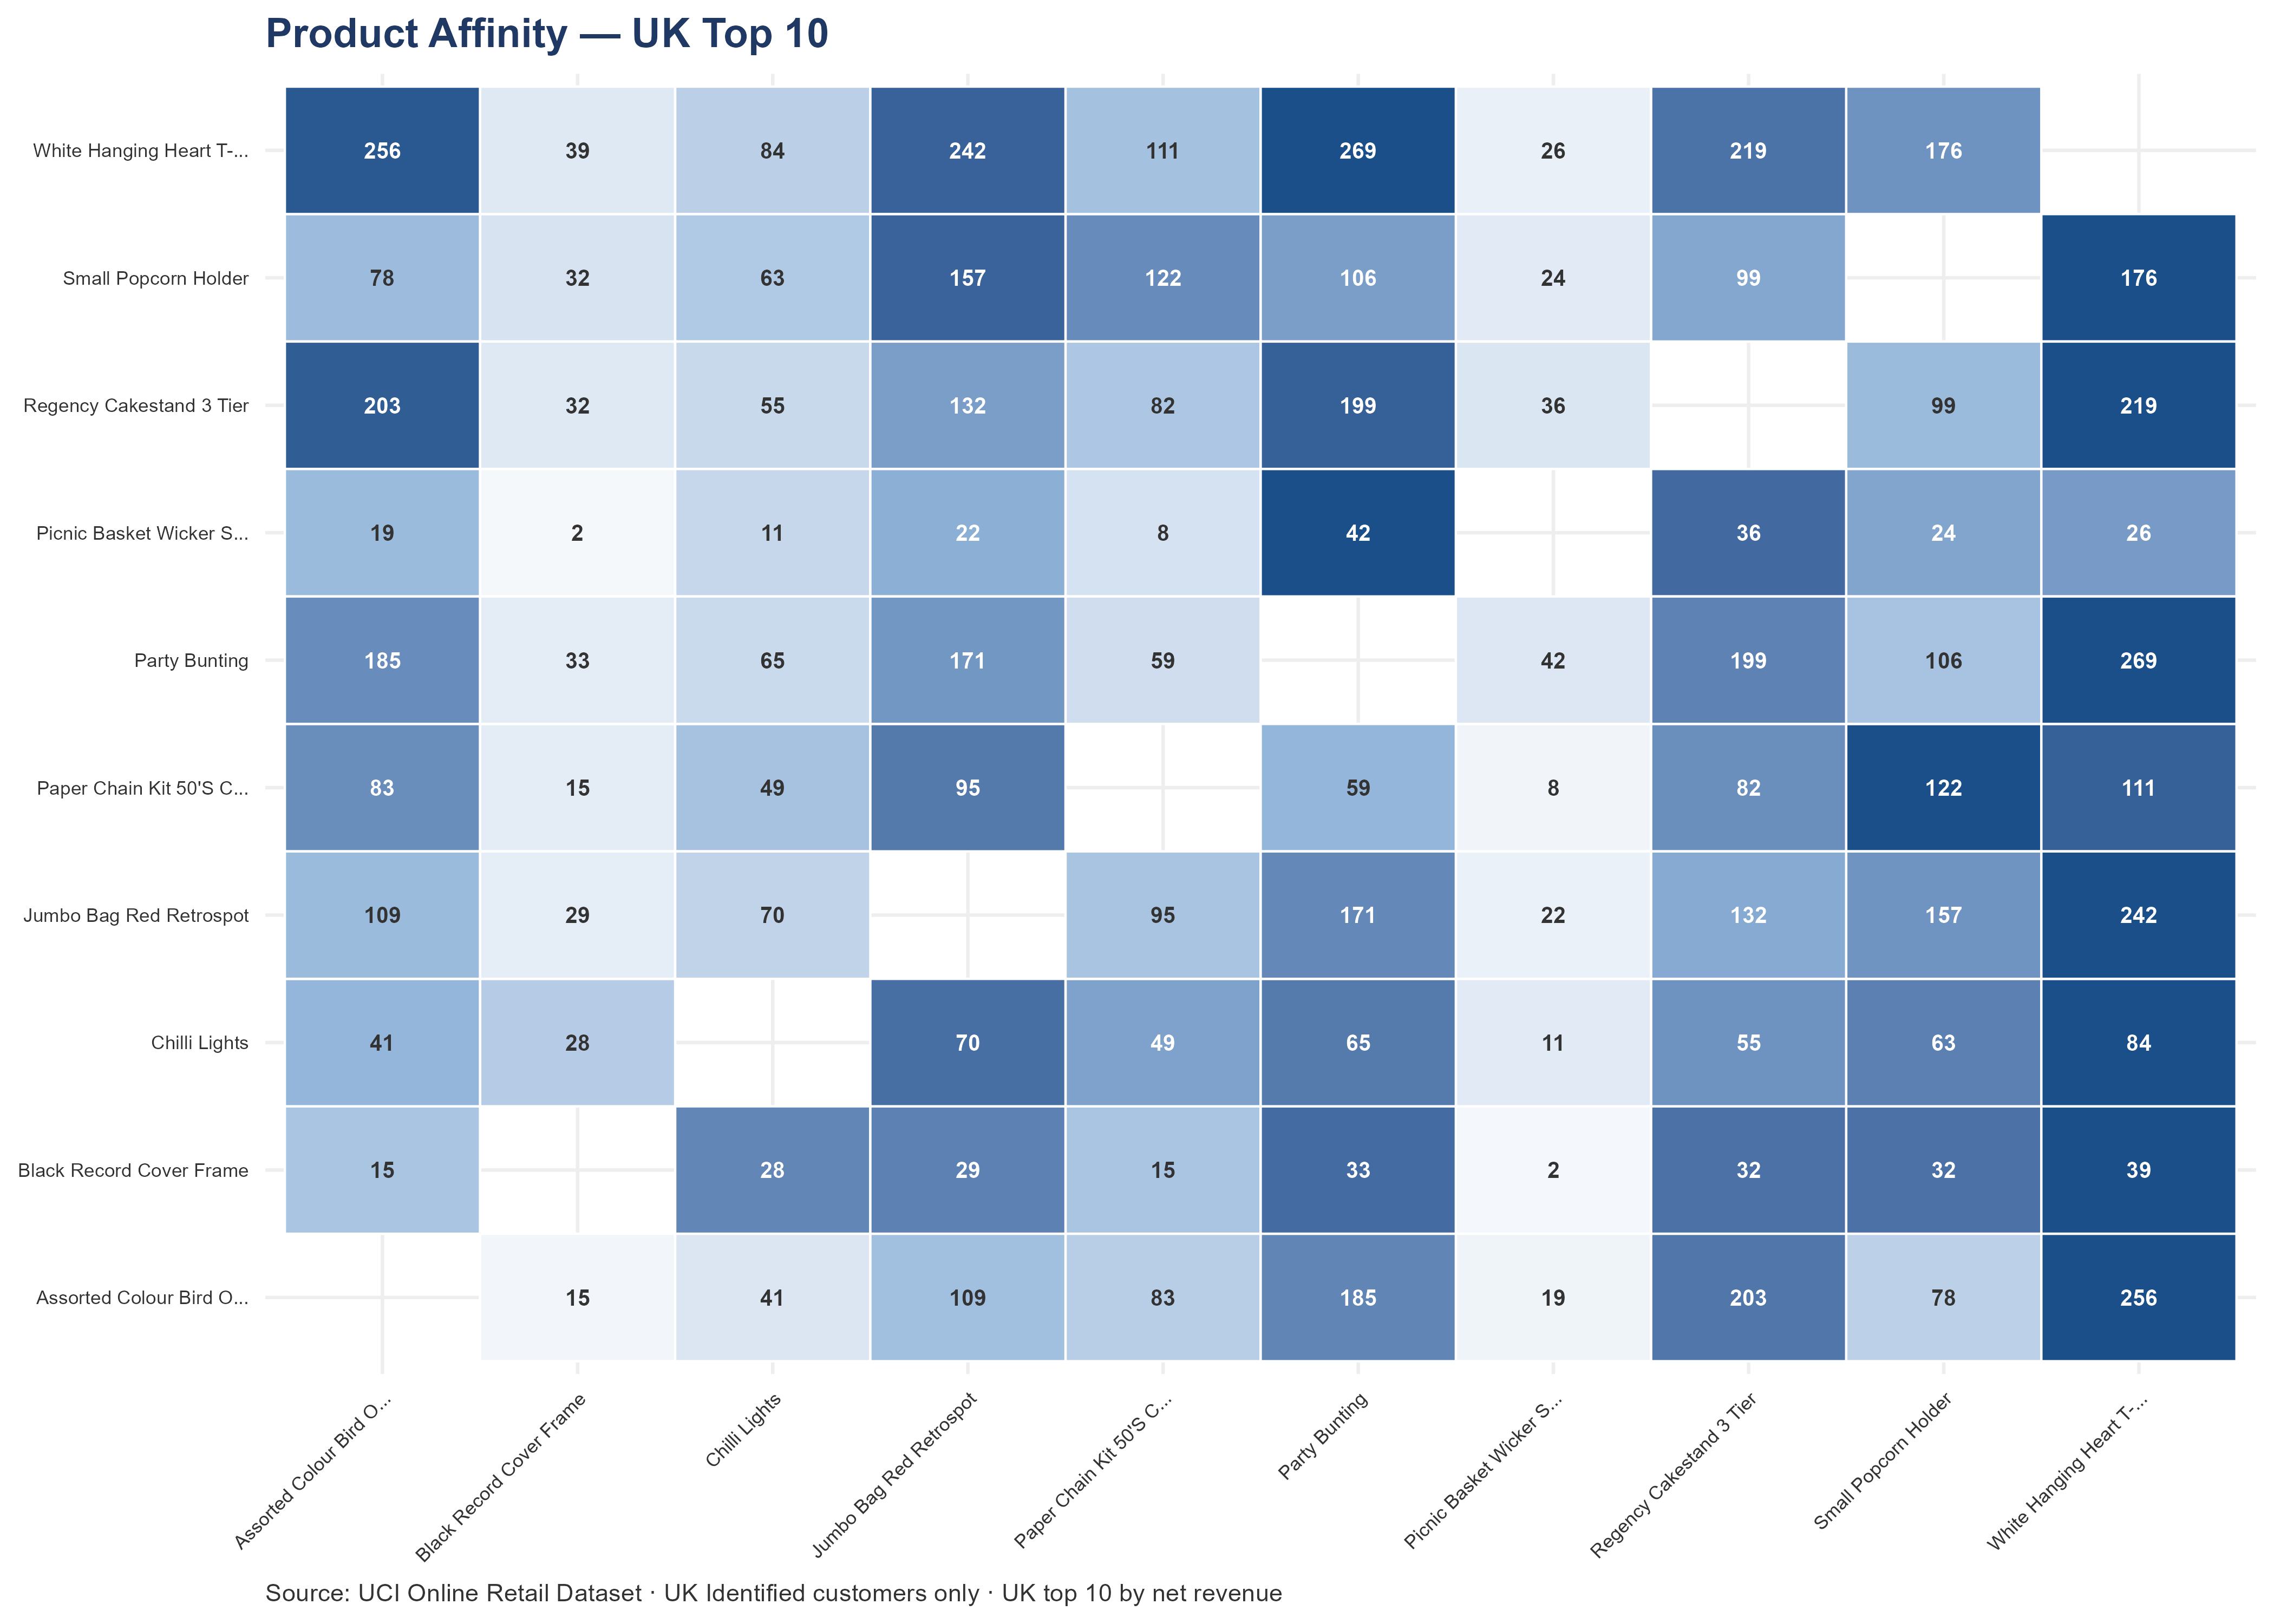
Co-purchase frequency among the UK top-10 products: how often two of these products appeared in the same UK customer order. This is the operationally correct affinity reference for UK cross-sell programs because it uses only UK customer transactions — international and anonymous orders are excluded so they cannot dilute or distort the pairings.
| Heatmap Label | Stock Code | Full Product Name |
|---|---|---|
| Assorted Colour Bird O... | 84879 | Assorted Colour Bird Ornament |
| Black Record Cover Frame | 21137 | Black Record Cover Frame |
| Chilli Lights | 79321 | Chilli Lights |
| Jumbo Bag Red Retrospot | 85099B | Jumbo Bag Red Retrospot |
| Paper Chain Kit 50'S C... | 22086 | Paper Chain Kit 50'S Christmas |
| Party Bunting | 47566 | Party Bunting |
| Picnic Basket Wicker S... | 22502 | Picnic Basket Wicker Small |
| Regency Cakestand 3 Tier | 22423 | Regency Cakestand 3 Tier |
| Small Popcorn Holder | 22197 | Small Popcorn Holder |
| White Hanging Heart T-... | 85123A | White Hanging Heart T-Light Holder |
Top 5 Cross-Sell Pairs — UK Account Team Actions
| Rank | Product A | Product B | Orders Together | A-only customers | B-only customers |
|---|---|---|---|---|---|
| 1 | Party Bunting | White Hanging Heart T-Light Holder | 269 | 420 | 582 |
| 2 | Assorted Colour Bird Ornament | White Hanging Heart T-Light Holder | 256 | 416 | 595 |
| 3 | Jumbo Bag Red Retrospot | White Hanging Heart T-Light Holder | 242 | 352 | 611 |
| 4 | Regency Cakestand 3 Tier | White Hanging Heart T-Light Holder | 219 | 523 | 577 |
| 5 | Regency Cakestand 3 Tier | Assorted Colour Bird Ornament | 203 | 533 | 408 |
21.3 C.3 · International Product Analysis
International-segment product detail.
21.3.1 Five Product Findings That Shape This Section
2,774 SKUs are active internationally, but 10 products generate 9.43% of international product revenue. The top 10 international products generate £141.22K combined. An acquirer evaluating inventory should focus due diligence on these 10 products: supplier contracts, stock levels, lead times, and substitutability.
Of the international top-10 products, 8 do not appear in the UK top 10. These products — Round Snack Boxes Set Of4 Woo…, Spaceboy Lunch Box, Dolly Girl Lunch Box, Round Snack Boxes Set Of 4 Fr…, Red Toadstool Led Night Light, Pink 3 Piece Polkadot Cutlery…, Set Of 3 Regency Cake Tins, Plasters In Tin Woodland Animals — have demand entirely dependent on international accounts.
No international top product derives 70%+ of revenue from a single country.
Account 14646 is both the revenue anchor and the product-demand anchor of the international segment. Account 14646 generates 33.24% of Rabbit Night Light’s international demand.
None of the top 10 products have significant revenue exposure to H1-silent accounts.
21.3.2 International Accounts That Went Silent Before Q4 (72) — Product Revenue Impact
| Rank | Product | Net Revenue | Silent Acct Rev | Silent Accts | % from Silent |
|---|---|---|---|---|---|
| 1 | Rabbit Night Light | £28.57K | £50 | 2 | 0.17% |
| 2 | Regency Cakestand 3 Tier | £21.80K | £921 | 13 | 4.05% |
| 3 | Round Snack Boxes Set Of4 Woo… | £17.95K | £283 | 11 | 1.55% |
| 4 | Spaceboy Lunch Box | £14.35K | £140 | 6 | 0.97% |
| 5 | Dolly Girl Lunch Box | £12.08K | £293 | 8 | 2.37% |
| 6 | Round Snack Boxes Set Of 4 Fr… | £10.48K | £233 | 10 | 2.18% |
| 7 | Red Toadstool Led Night Light | £10.11K | £198 | 7 | 1.92% |
| 8 | Pink 3 Piece Polkadot Cutlery… | £9.87K | £56 | 3 | 0.56% |
| 9 | Set Of 3 Regency Cake Tins | £8.01K | £20 | 1 | 0.25% |
| 10 | Plasters In Tin Woodland Animals | £8.00K | £139 | 7 | 1.70% |
21.3.3 Top 10 International Products by Net Revenue
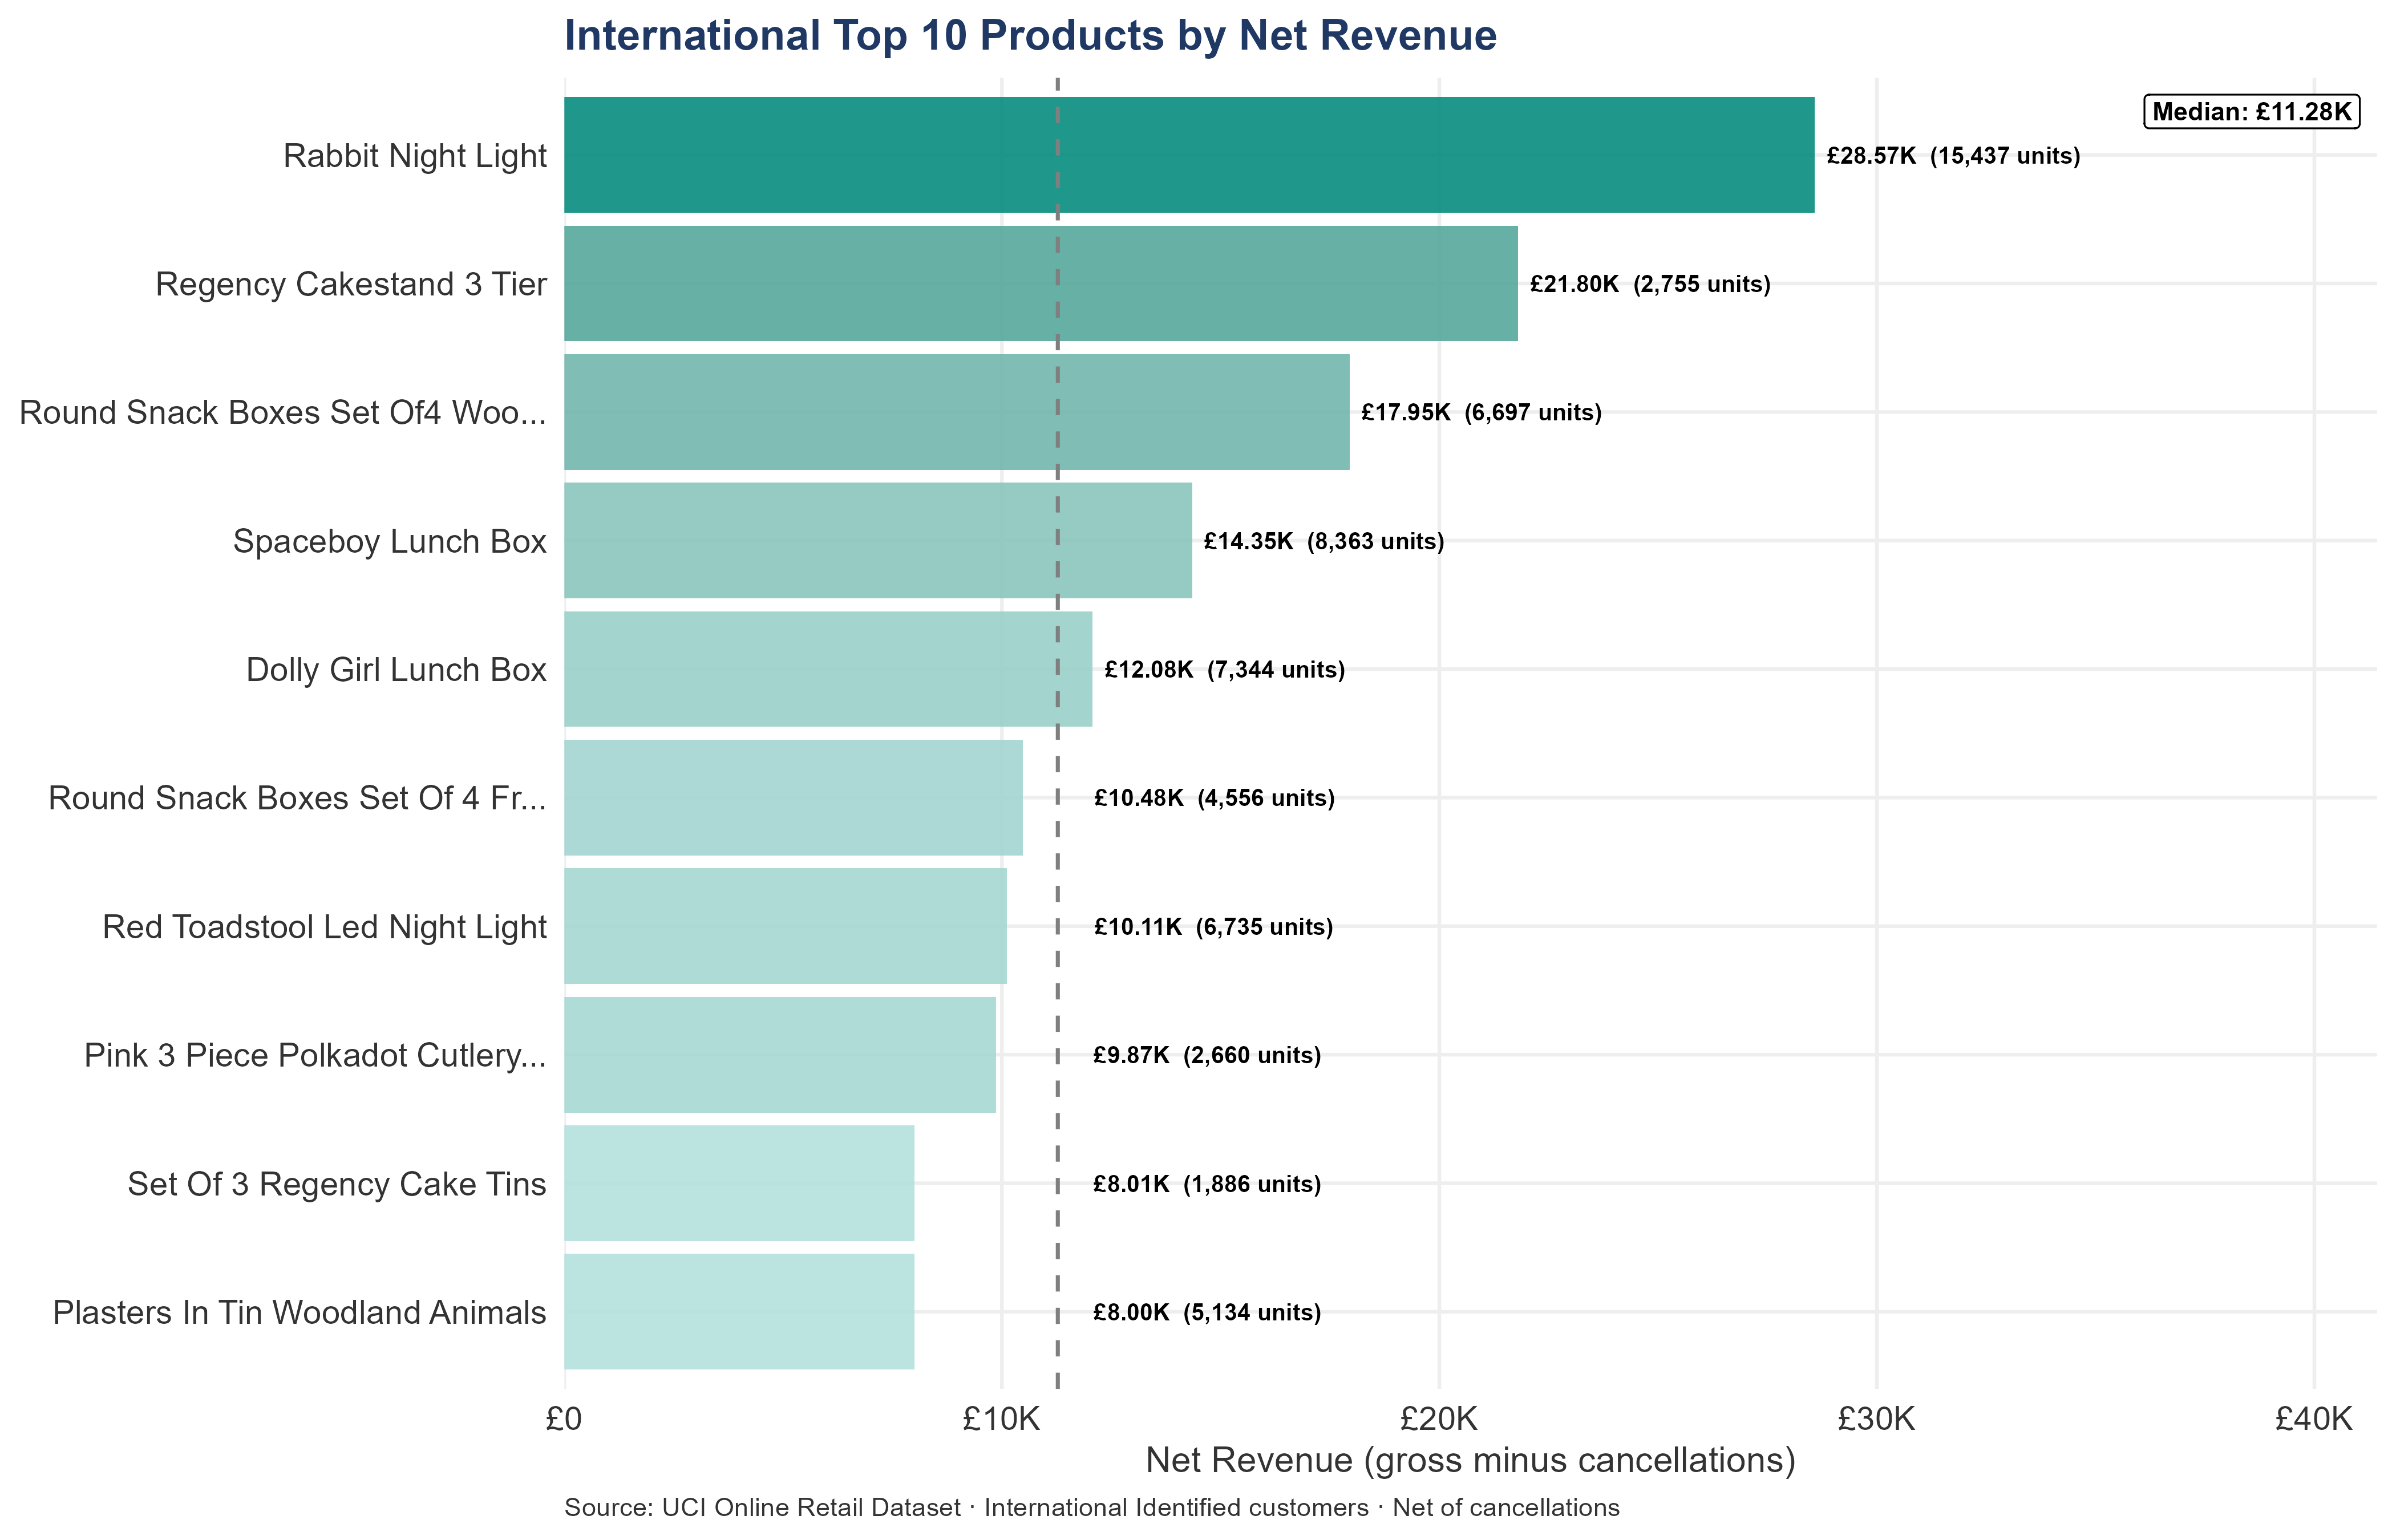
| Rank | Product | Stock Code | Gross Revenue | Cancellations | Net Revenue | Cancel Rate | Units Sold | Rev / Unit |
|---|---|---|---|---|---|---|---|---|
| 1 | Rabbit Night Light | 23084 | £28.78K | £208 | £28.57K | 0.72% | 15,437 | £1.85 |
| 2 | Regency Cakestand 3 Tier | 22423 | £31.53K | £9.72K | £21.80K | 30.84% | 2,755 | £7.91 |
| 3 | Round Snack Boxes Set Of4 Woo… | 22326 | £18.07K | £121 | £17.95K | 0.67% | 6,697 | £2.68 |
| 4 | Spaceboy Lunch Box | 22629 | £14.45K | £93 | £14.35K | 0.64% | 8,363 | £1.72 |
| 5 | Dolly Girl Lunch Box | 22630 | £12.55K | £479 | £12.08K | 3.81% | 7,344 | £1.64 |
| 6 | Round Snack Boxes Set Of 4 Fr… | 22328 | £12.17K | £1.69K | £10.48K | 13.90% | 4,556 | £2.30 |
| 7 | Red Toadstool Led Night Light | 21731 | £10.39K | £281 | £10.11K | 2.71% | 6,735 | £1.50 |
| 8 | Pink 3 Piece Polkadot Cutlery… | 84997D | £9.97K | £109 | £9.87K | 1.09% | 2,660 | £3.71 |
| 9 | Set Of 3 Regency Cake Tins | 23245 | £8.43K | £422 | £8.01K | 5.00% | 1,886 | £4.24 |
| 10 | Plasters In Tin Woodland Animals | 22554 | £8.05K | £48 | £8.00K | 0.59% | 5,134 | £1.56 |
The top 10 international products combined generate £141.22K — 9.43% of total international segment revenue. That is 10 products out of 2,774 active international SKUs. Cross-segment overlap: 1 product (Regency Cakestand 3 Tier, stock code 22423) appears in both top 10s — natural cross-segment buffer. Remaining 9 products are unique to the international top 10. For international products, cancellations carry higher operational cost than UK cancellations: shipping, customs, and logistics for cancelled international orders are not recoverable.
21.3.4 International Product Demand by Country and Region
| Rank | Product | Net Revenue | Countries | Top Market | Top Market Share | Breadth |
|---|---|---|---|---|---|---|
| 1 | Rabbit Night Light | £28.57K | 18 | Netherlands | 33.24% | 🟢 Multi-market demand |
| 2 | Regency Cakestand 3 Tier | £21.80K | 27 | Germany | 28.74% | 🟢 Multi-market demand |
| 3 | Round Snack Boxes Set Of4… | £17.95K | 20 | Netherlands | 44.23% | 🟢 Multi-market demand |
| 4 | Spaceboy Lunch Box | £14.35K | 16 | Netherlands | 51.82% | 🟡 Top-market concentrated |
| 5 | Dolly Girl Lunch Box | £12.08K | 18 | Netherlands | 54.39% | 🟡 Top-market concentrated |
| 6 | Round Snack Boxes Set Of … | £10.48K | 14 | Netherlands | 33.18% | 🟢 Multi-market demand |
| 7 | Red Toadstool Led Night L… | £10.11K | 16 | Netherlands | 33.48% | 🟢 Multi-market demand |
| 8 | Childrens Cutlery Polkado… | £9.87K | 20 | Spain | 39.68% | 🟢 Multi-market demand |
| 9 | Set Of 3 Regency Cake Tins | £8.01K | 21 | Netherlands | 20.78% | 🟢 Multi-market demand |
| 10 | Plasters In Tin Woodland … | £8.00K | 19 | Netherlands | 27.67% | 🟢 Multi-market demand |
21.3.5 International Top 10 — Account Concentration
| Rank | Product | Net Revenue | Accounts | Countries | Top Account | Top Acct Mkt | Top 1 % | Top 3 % |
|---|---|---|---|---|---|---|---|---|
| 1 | Rabbit Night Light | £28.78K | 72 | 18 | 14646 | Netherlands | 33.24% | 63.25% |
| 2 | Regency Cakestand 3 Tier | £31.53K | 112 | 27 | 12471 | Germany | 15.00% | 37.67% |
| 3 | Round Snack Boxes Set Of4 W… | £18.07K | 124 | 20 | 14646 | Netherlands | 44.04% | 53.16% |
| 4 | Spaceboy Lunch Box | £14.45K | 89 | 16 | 14646 | Netherlands | 51.33% | 65.98% |
| 5 | Dolly Girl Lunch Box | £12.55K | 78 | 18 | 14646 | Netherlands | 53.83% | 74.05% |
| 6 | Round Snack Boxes Set Of 4 … | £12.17K | 85 | 14 | 14646 | Netherlands | 33.18% | 66.39% |
| 7 | Red Toadstool Led Night Light | £10.39K | 88 | 16 | 14646 | Netherlands | 33.29% | 52.22% |
| 8 | Pink 3 Piece Polkadot Cutle… | £9.97K | 61 | 20 | 12557 | Spain | 39.30% | 75.47% |
| 9 | Set Of 3 Regency Cake Tins | £8.43K | 73 | 21 | 14646 | Netherlands | 20.55% | 47.16% |
| 10 | Plasters In Tin Woodland An… | £8.05K | 111 | 19 | 14646 | Netherlands | 27.67% | 36.29% |
International product demand is more account-concentrated than UK product demand because the account base is smaller. With fewer accounts buying each product, the loss of any single account moves the needle more. Every product where the top account generates more than 30% of revenue has a named-account dependency that should be managed explicitly.
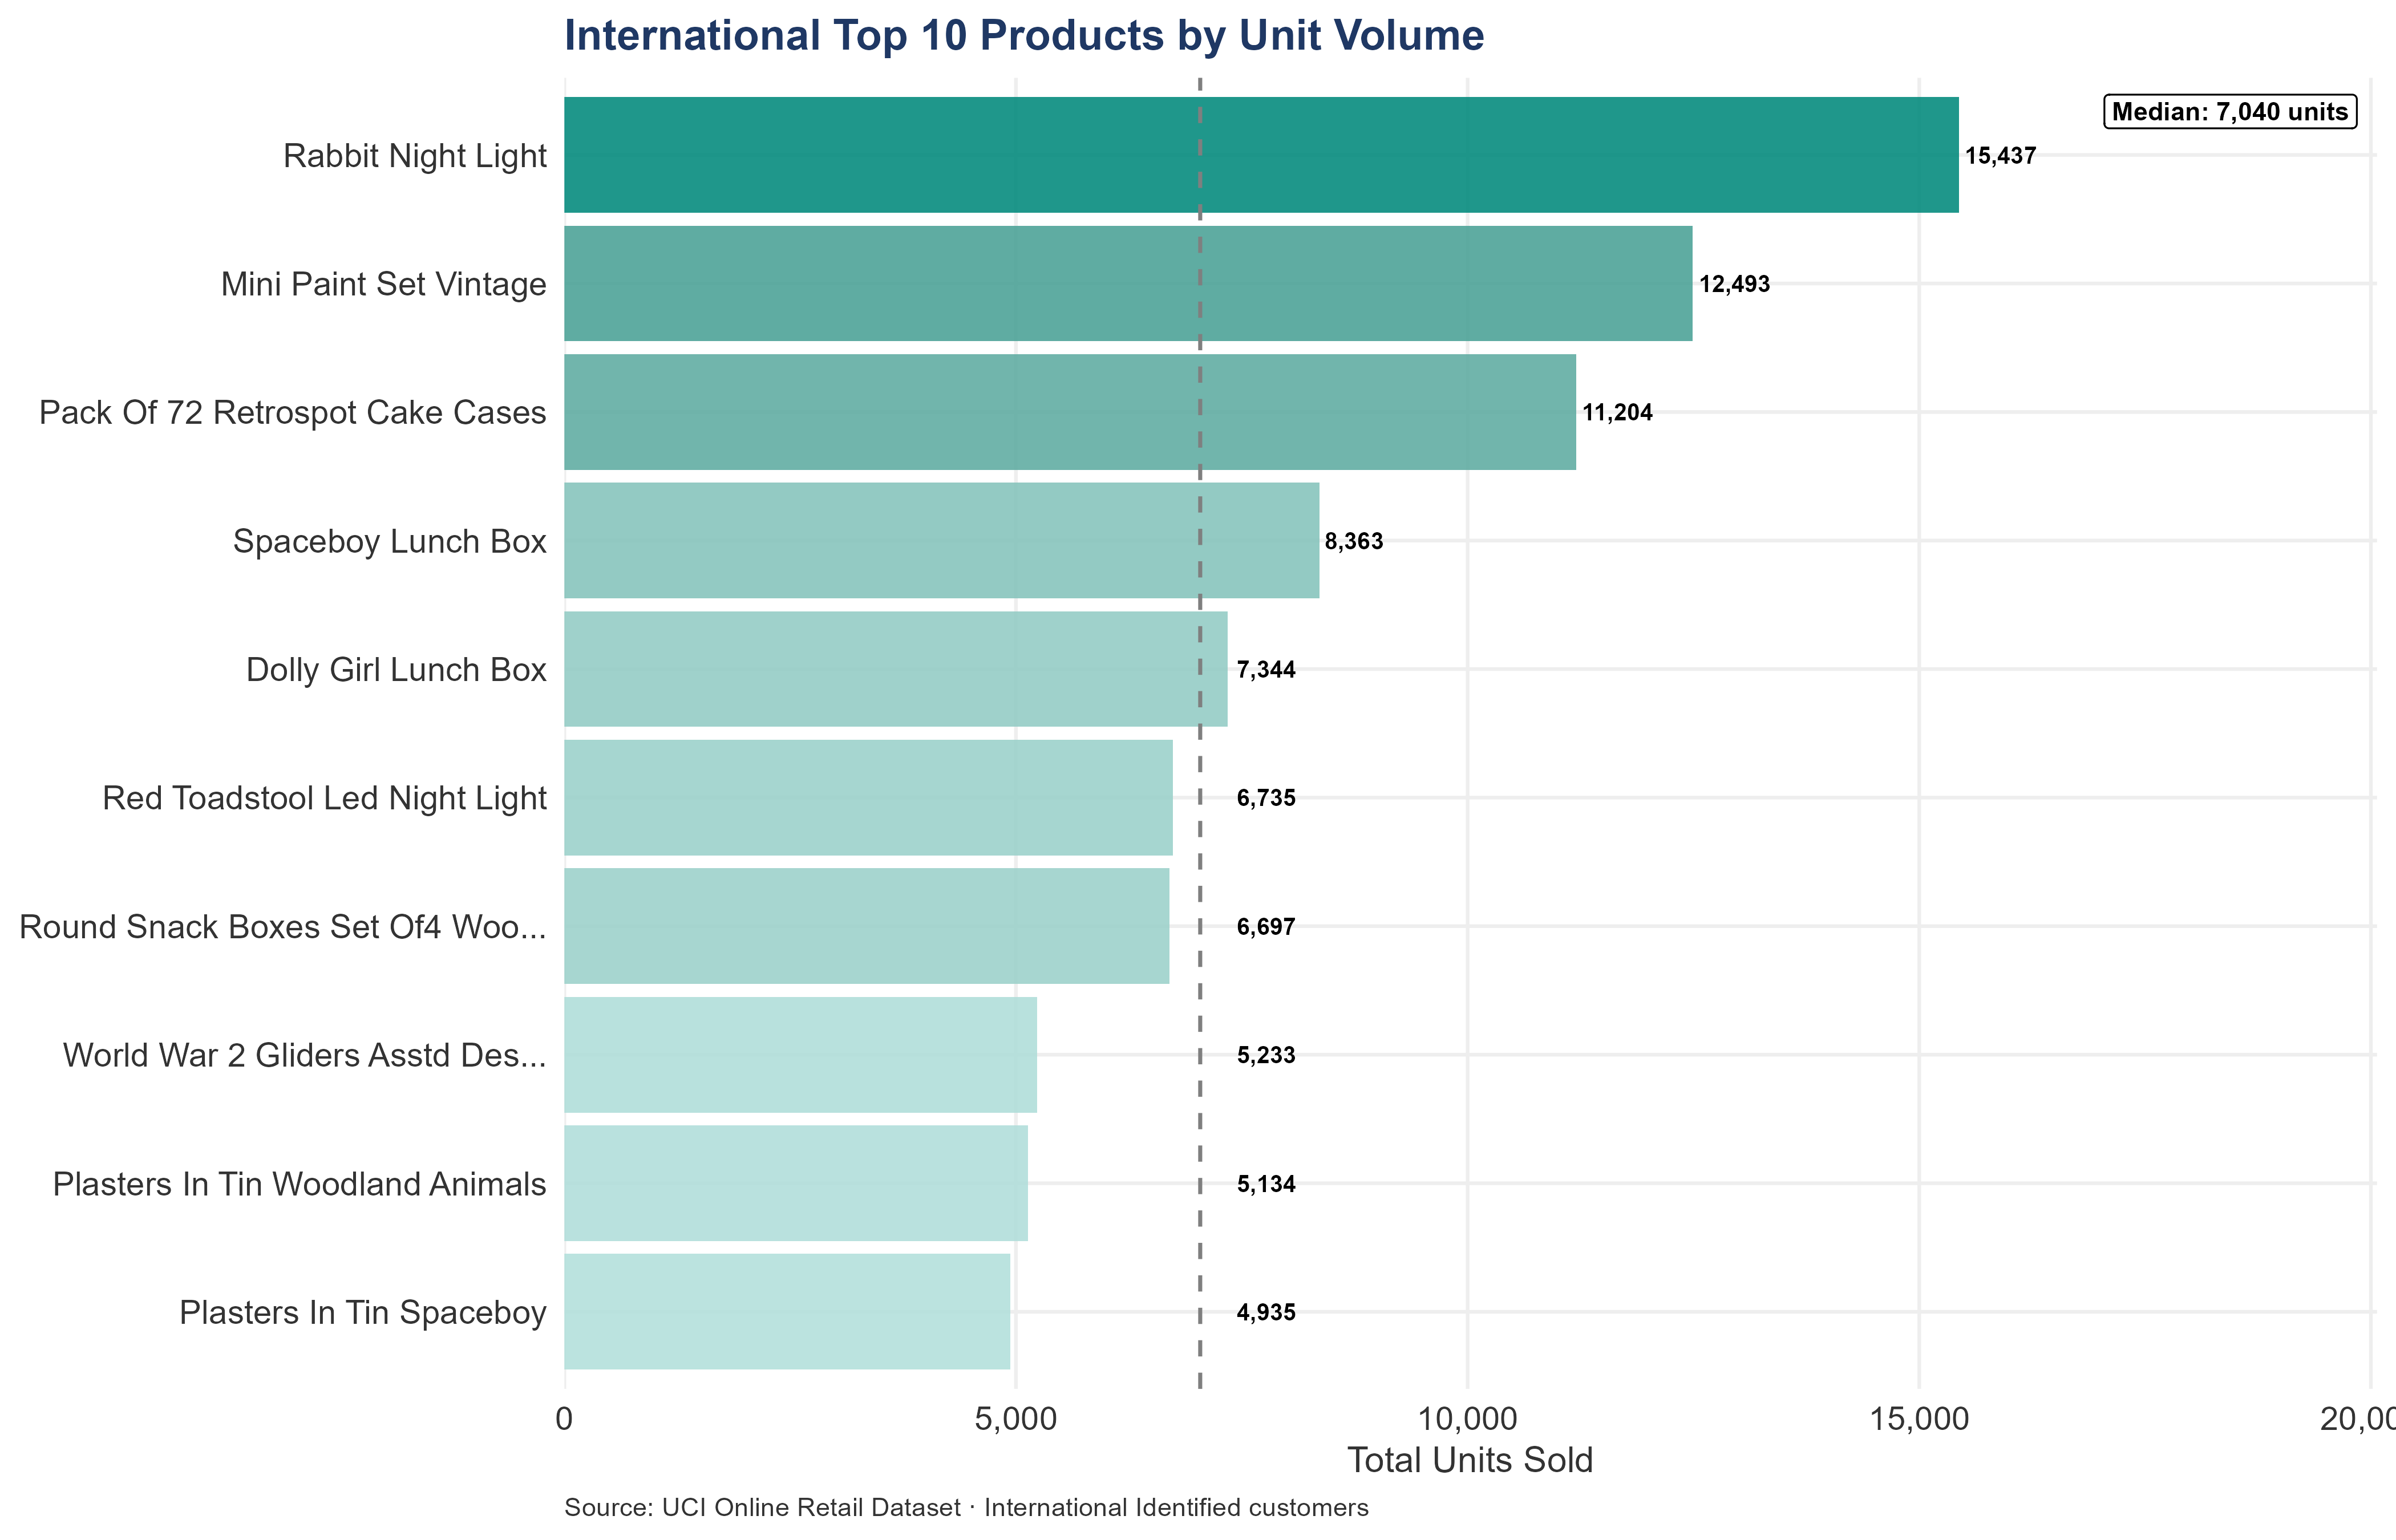
21.3.6 Top 10 International Products by Unit Volume
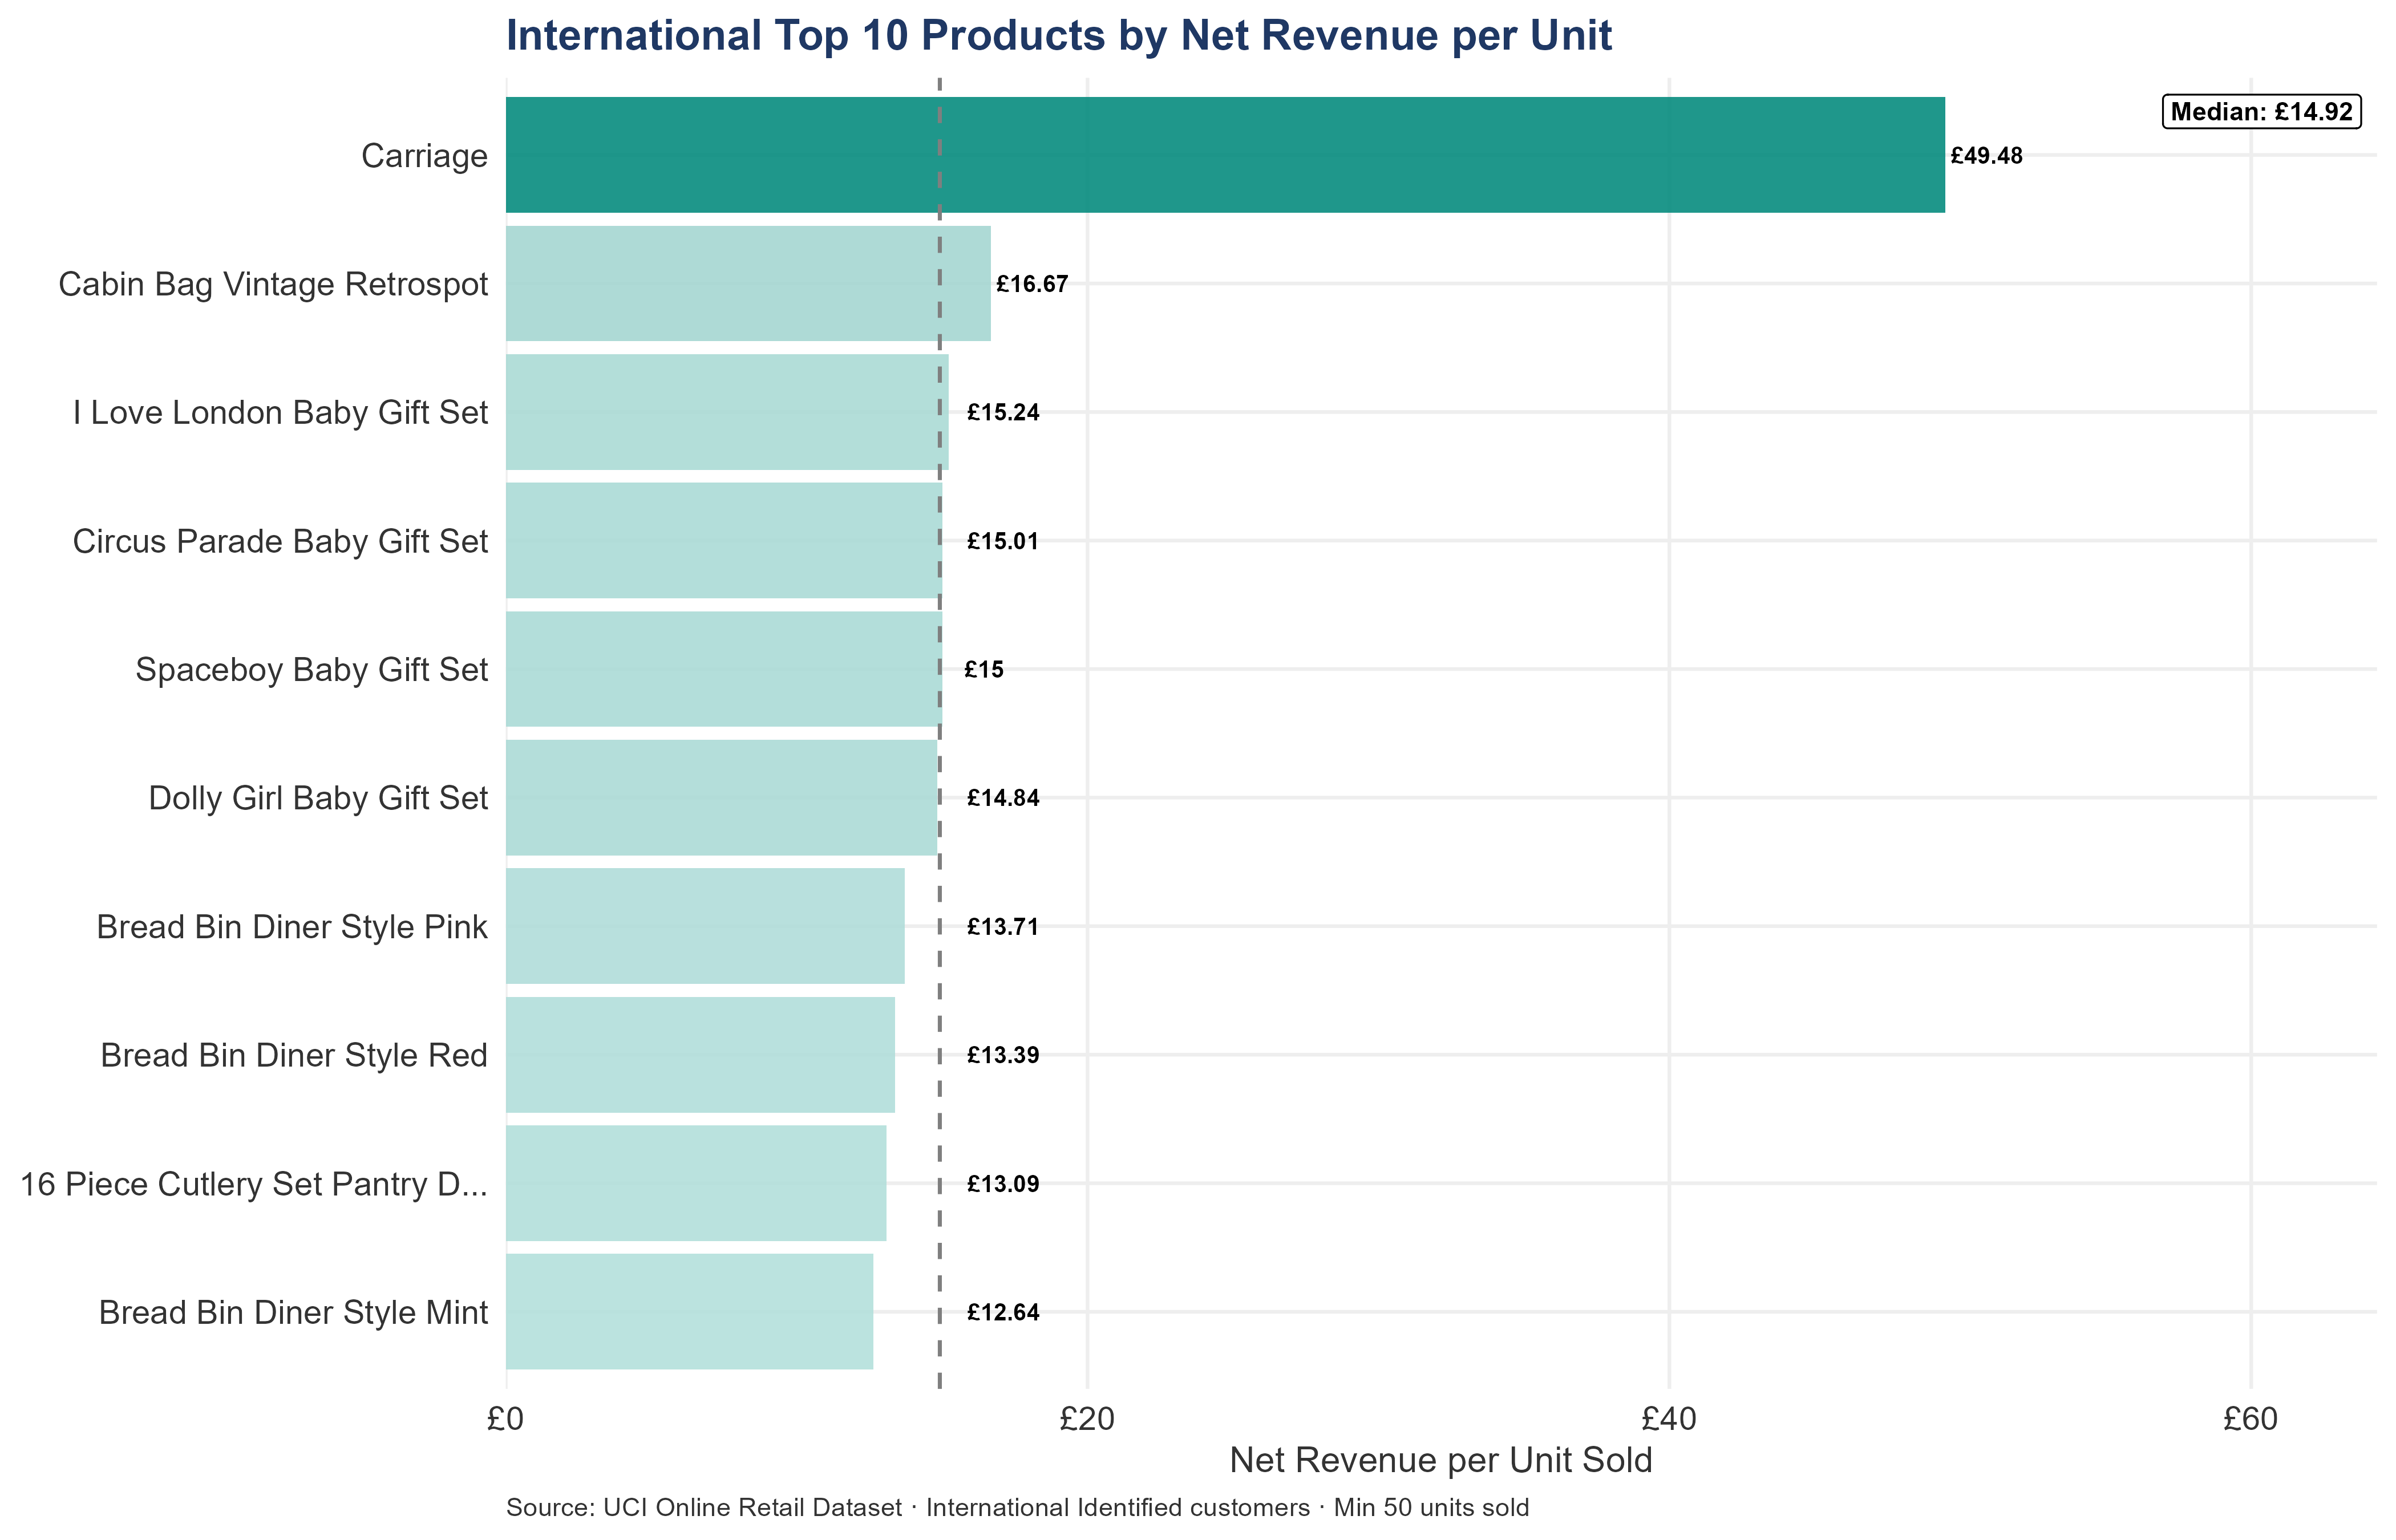
21.3.7 Top 10 International Products by Revenue per Unit
21.3.8 International-Exclusive Products
Of the top-10 international products, 8 have no demand buffer from UK or anonymous customers.
| Intl Rank | Product | Stock Code | Net Revenue | Units Sold | Cancel Rate |
|---|---|---|---|---|---|
| 3 | Round Snack Boxes Set Of4 Woo… | 22326 | £17.95K | 6,697 | 0.67% |
| 4 | Spaceboy Lunch Box | 22629 | £14.35K | 8,363 | 0.64% |
| 5 | Dolly Girl Lunch Box | 22630 | £12.08K | 7,344 | 3.81% |
| 6 | Round Snack Boxes Set Of 4 Fr… | 22328 | £10.48K | 4,556 | 13.90% |
| 7 | Red Toadstool Led Night Light | 21731 | £10.11K | 6,735 | 2.71% |
| 8 | Pink 3 Piece Polkadot Cutlery… | 84997D | £9.87K | 2,660 | 1.09% |
| 9 | Set Of 3 Regency Cake Tins | 23245 | £8.01K | 1,886 | 5.00% |
| 10 | Plasters In Tin Woodland Animals | 22554 | £8.00K | 5,134 | 0.59% |
| Intl Rank | Product | Total Net Rev | # Accounts | # Countries | Top Account | Top Acct Market | Top 1 Share | Top 3 Share | Risk Signal |
|---|---|---|---|---|---|---|---|---|---|
| 3 | Round Snack Boxes Set Of4 W… | £18.07K | 124 | 20 | 14646 | Netherlands | 44.04% | 53.16% | 🟡 Moderate concentration |
| 4 | Spaceboy Lunch Box | £14.45K | 89 | 16 | 14646 | Netherlands | 51.33% | 65.98% | ⚠ Single-account dependency |
| 5 | Dolly Girl Lunch Box | £12.55K | 78 | 18 | 14646 | Netherlands | 53.83% | 74.05% | ⚠ Single-account dependency |
| 6 | Round Snack Boxes Set Of 4 … | £12.17K | 85 | 14 | 14646 | Netherlands | 33.18% | 66.39% | 🟡 Moderate concentration |
| 7 | Red Toadstool Led Night Light | £10.39K | 88 | 16 | 14646 | Netherlands | 33.29% | 52.22% | 🟡 Moderate concentration |
| 8 | Pink 3 Piece Polkadot Cutle… | £9.97K | 61 | 20 | 12557 | Spain | 39.30% | 75.47% | 🟡 Top-3 concentrated |
| 9 | Set Of 3 Regency Cake Tins | £8.43K | 73 | 21 | 14646 | Netherlands | 20.55% | 47.16% | 🟢 Distributed demand |
| 10 | Plasters In Tin Woodland An… | £8.05K | 111 | 19 | 14646 | Netherlands | 27.67% | 36.29% | 🟢 Distributed demand |
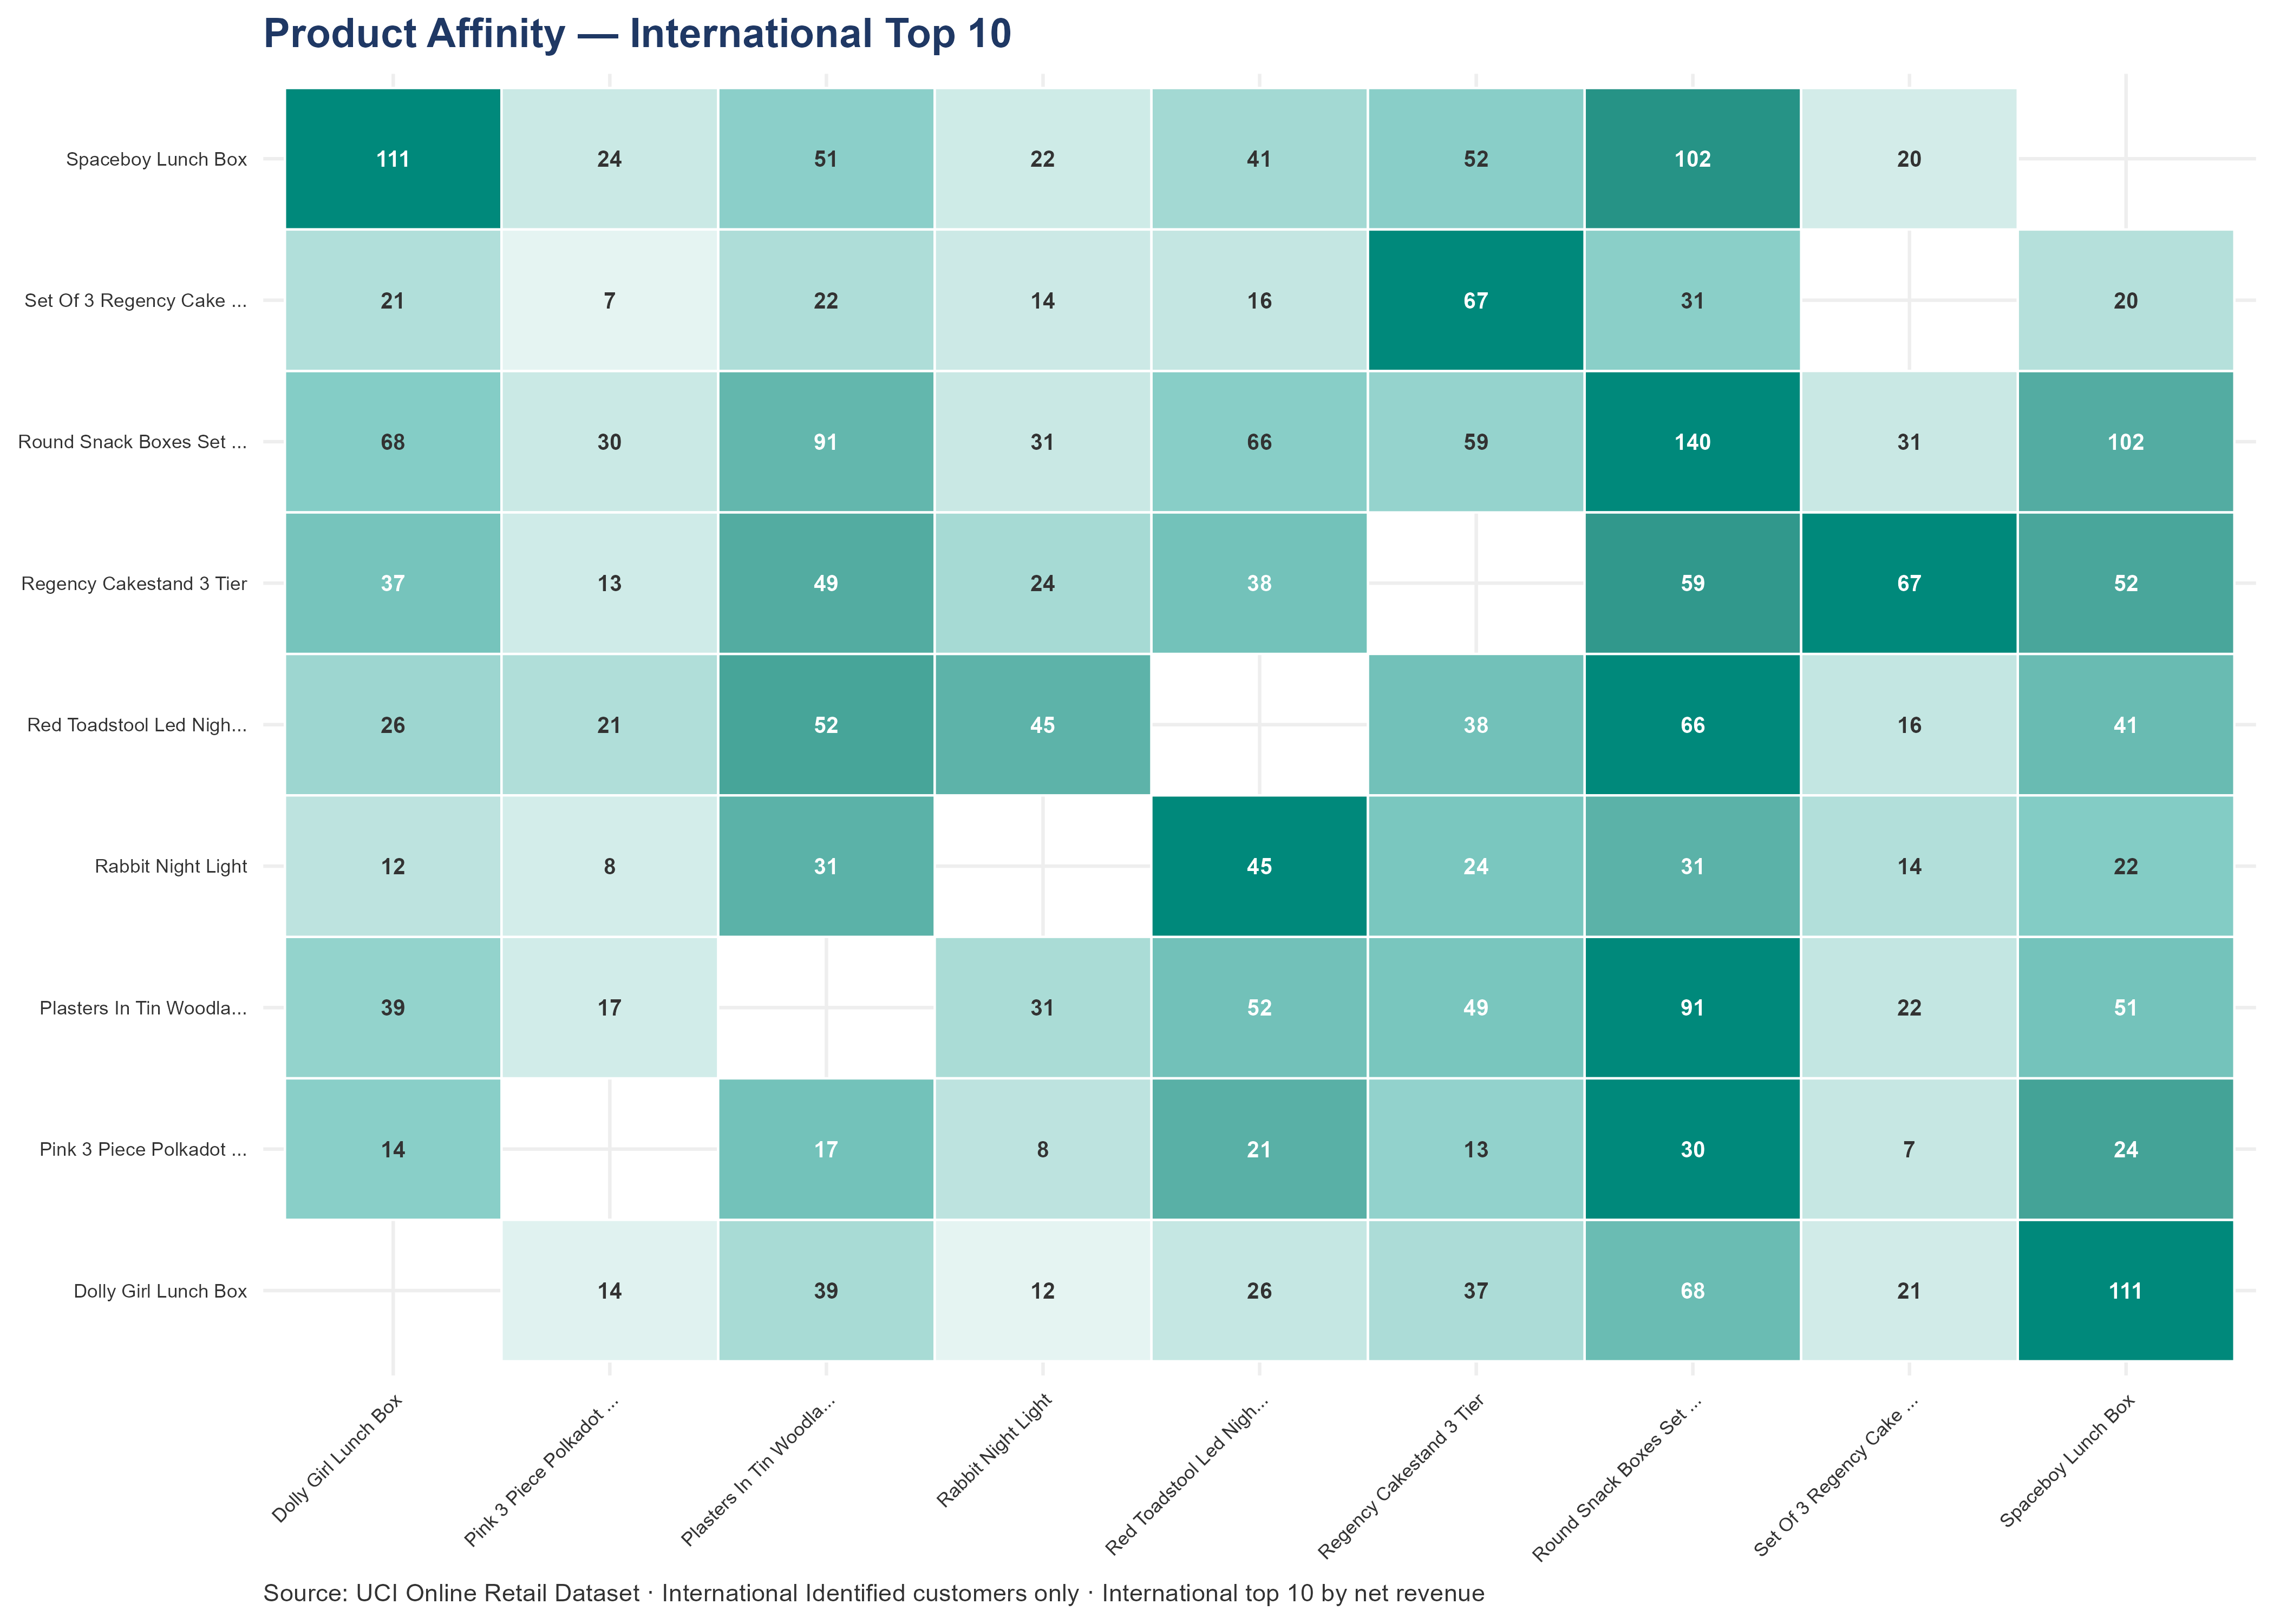
21.3.9 Product Affinity — International Top 10
Co-purchase frequency among the international top-10 products: how often two of these products appeared in the same international customer order. This is the operationally correct affinity reference for international cross-sell programs because it uses only international customer transactions — UK and anonymous orders are excluded. International accounts buy a different catalog from UK accounts (only 1 product overlaps in the top 10), so this matrix is structurally different from the UK affinity matrix in C.2.
| Heatmap Label | Stock Code | Full Product Name |
|---|---|---|
| Dolly Girl Lunch Box | 22630 | Dolly Girl Lunch Box |
| Pink 3 Piece Polkadot ... | 84997D | Pink 3 Piece Polkadot Cutlery Set |
| Plasters In Tin Woodla... | 22554 | Plasters In Tin Woodland Animals |
| Rabbit Night Light | 23084 | Rabbit Night Light |
| Red Toadstool Led Nigh... | 21731 | Red Toadstool Led Night Light |
| Regency Cakestand 3 Tier | 22423 | Regency Cakestand 3 Tier |
| Round Snack Boxes Set ... | 22326 | Round Snack Boxes Set Of4 Woodland |
| Round Snack Boxes Set ... | 22328 | Round Snack Boxes Set Of 4 Fruits |
| Set Of 3 Regency Cake ... | 23245 | Set Of 3 Regency Cake Tins |
| Spaceboy Lunch Box | 22629 | Spaceboy Lunch Box |
Top 5 Cross-Sell Pairs — International Account Team Actions
| Rank | Product A | Product B | Orders Together | A-only customers | B-only customers |
|---|---|---|---|---|---|
| 1 | Round Snack Boxes Set Of4 Woodland | Round Snack Boxes Set Of 4 Fruits | 140 | 50 | 11 |
| 2 | Spaceboy Lunch Box | Dolly Girl Lunch Box | 111 | 29 | 18 |
| 3 | Round Snack Boxes Set Of4 Woodland | Spaceboy Lunch Box | 102 | 63 | 28 |
| 4 | Round Snack Boxes Set Of4 Woodland | Plasters In Tin Woodland Animals | 91 | 57 | 44 |
| 5 | Round Snack Boxes Set Of4 Woodland | Dolly Girl Lunch Box | 68 | 77 | 31 |
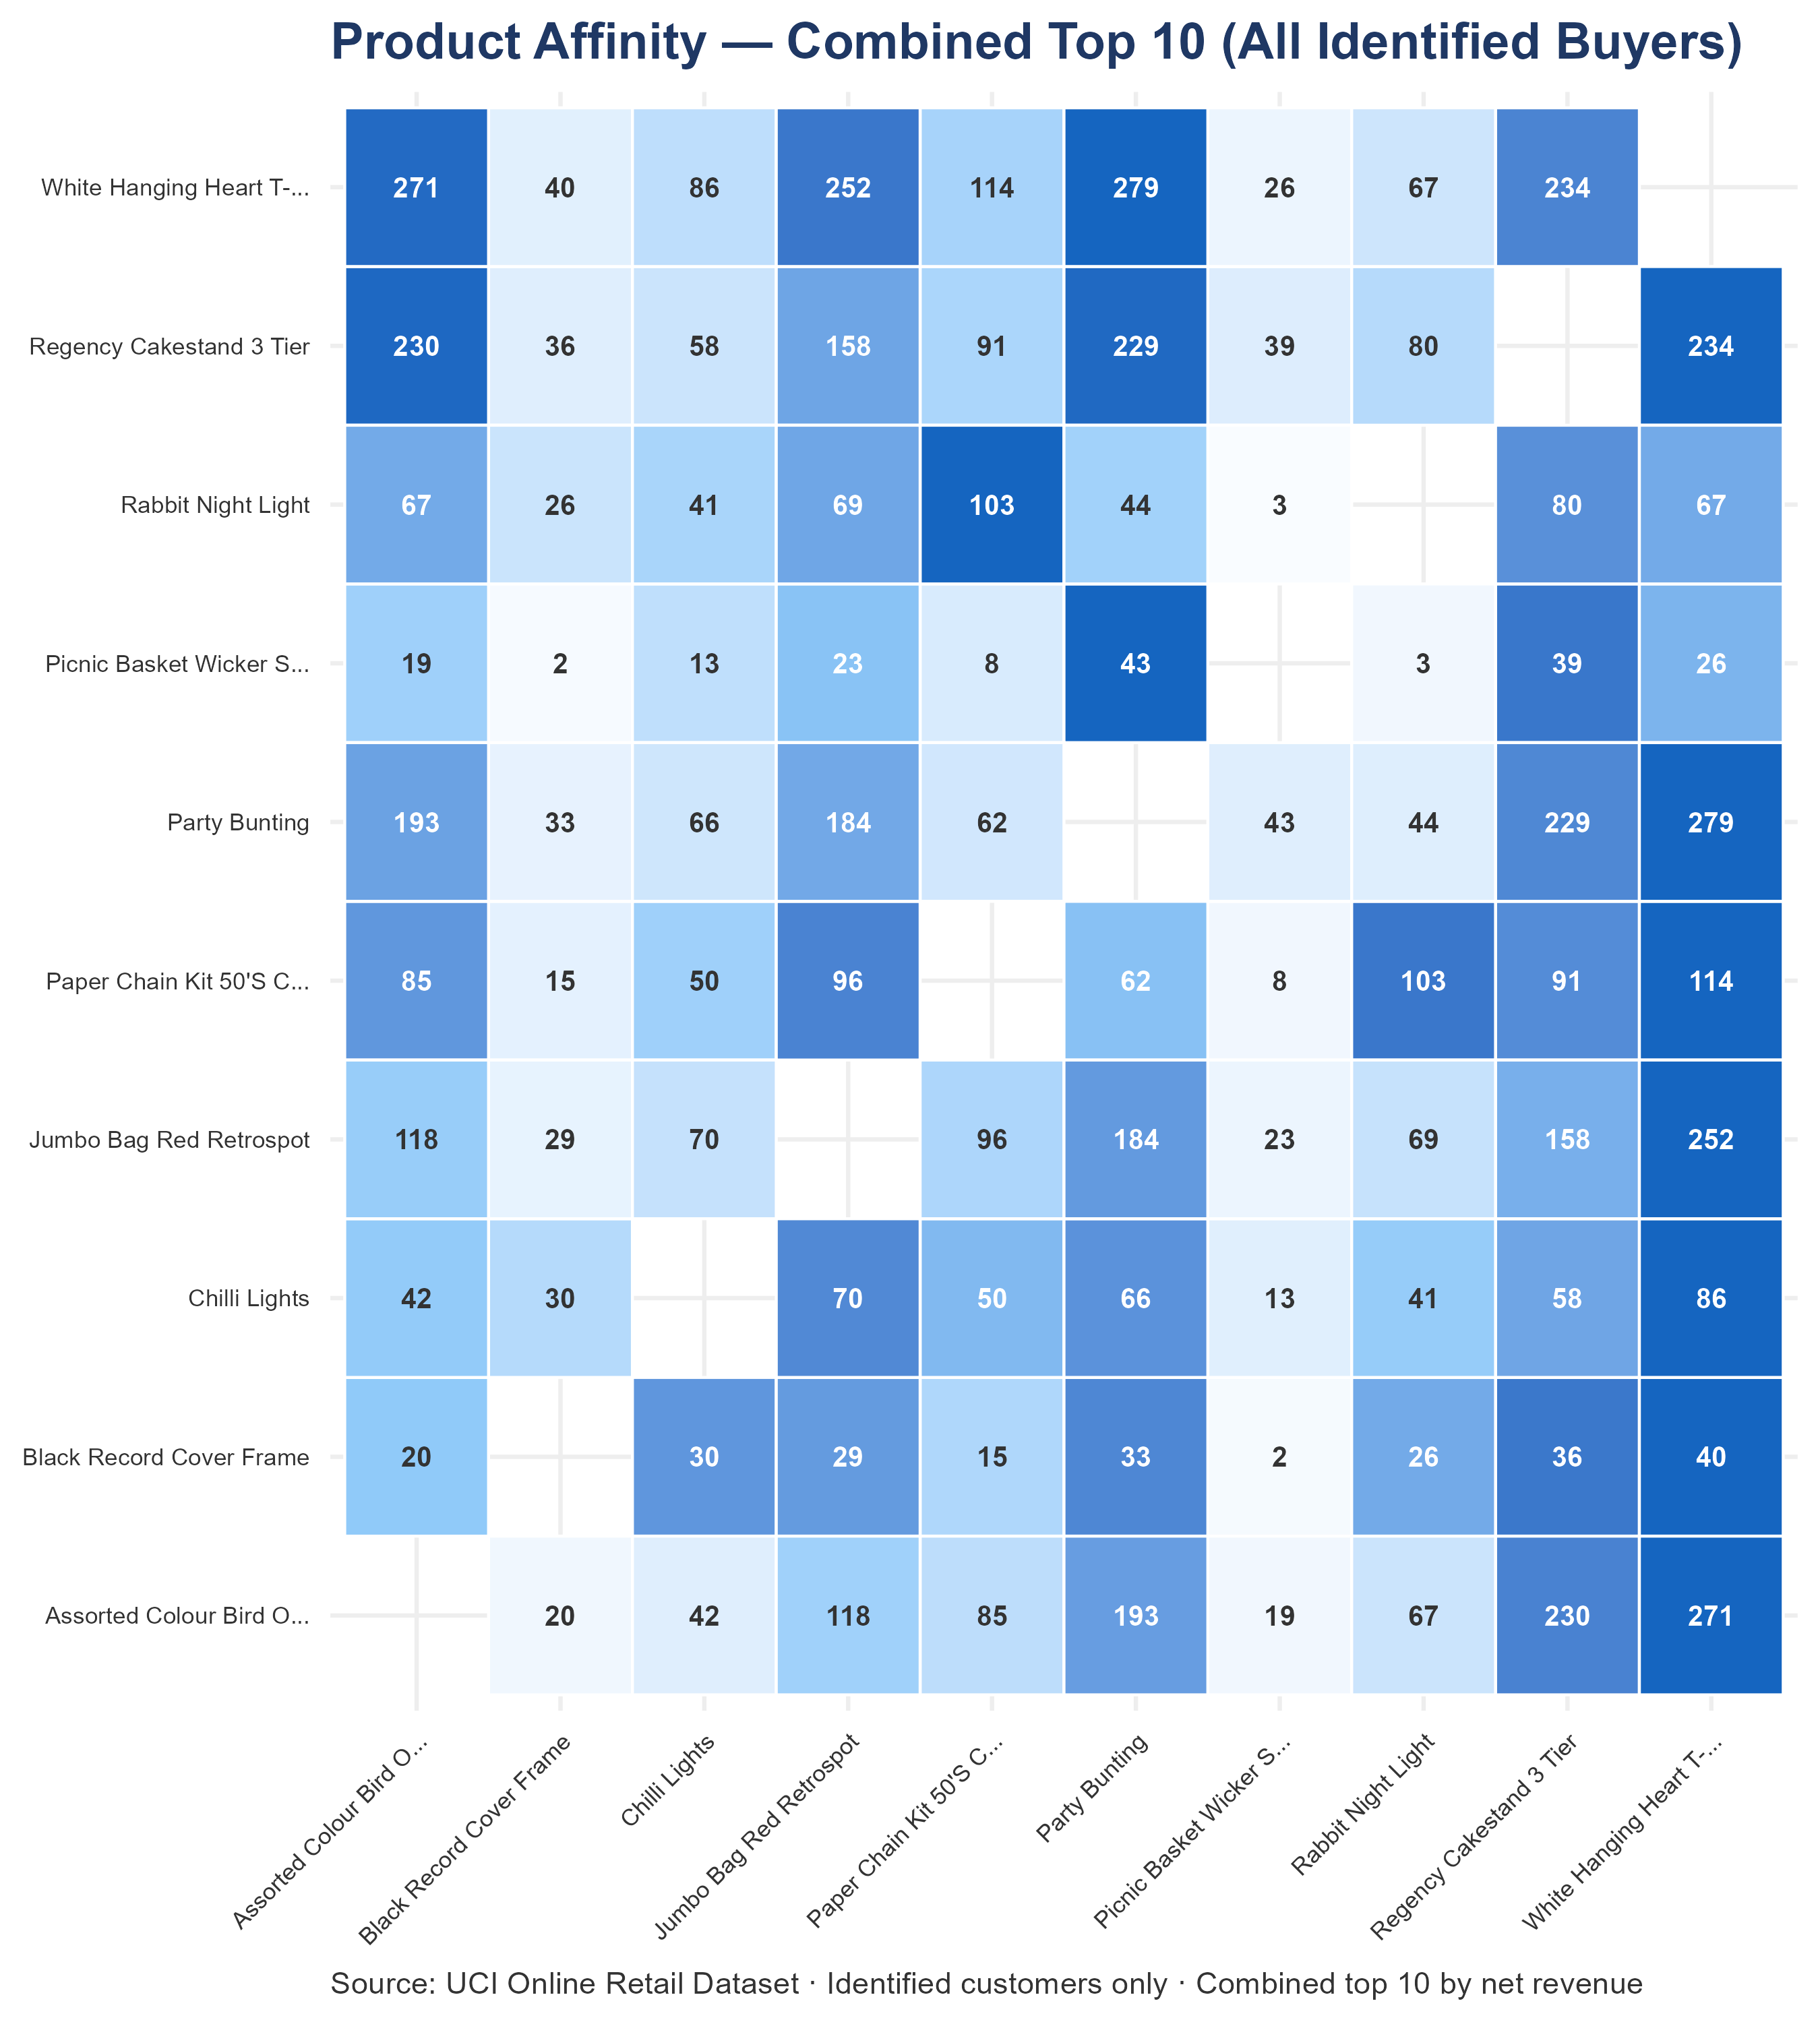
21.4 C.4 · Product Affinity — Combined View
Whole-business view across all identified customers.
This combined view uses all identified customers regardless of segment. It shows which product pairs are most frequently purchased together across the full customer base. UK and International customers purchase largely different product catalogs (only 1 of the top-10 products overlaps across segments), which means the whole-business affinity pairs may not reflect the cross-sell opportunity within each segment. Anonymous orders are excluded from this co-occurrence analysis — without CustomerID, individual transactions cannot be linked to repeat customers.
This heatmap shows co-purchase frequency — how often two products appeared in the same order. It does not show whether customers who currently purchase only one product from a strong pair would respond to a cross-sell recommendation. Use this heatmap to identify which conversations to start, not to predict how those conversations will end.
Cross-sell applications:
- Identify your customer’s primary product (find its row or column).
- Locate the darkest cell in that row — that is the most frequently co-purchased pairing for customers of that product.
- Check whether your customer currently orders the paired product.
- If they do not, that is the starting point for the cross-sell conversation.
- Validate the pairing makes sense for this specific customer’s market and use case before outreach.
| Heatmap Label | Stock Code | Full Product Name |
|---|---|---|
| Assorted Colour Bird O... | 84879 | Assorted Colour Bird Ornament |
| Black Record Cover Frame | 21137 | Black Record Cover Frame |
| Chilli Lights | 79321 | Chilli Lights |
| Jumbo Bag Red Retrospot | 85099B | Jumbo Bag Red Retrospot |
| Paper Chain Kit 50'S C... | 22086 | Paper Chain Kit 50'S Christmas |
| Party Bunting | 47566 | Party Bunting |
| Picnic Basket Wicker S... | 22502 | Picnic Basket Wicker Small |
| Rabbit Night Light | 23084 | Rabbit Night Light |
| Regency Cakestand 3 Tier | 22423 | Regency Cakestand 3 Tier |
| White Hanging Heart T-... | 85123A | White Hanging Heart T-Light Holder |
Top 5 Cross-Sell Pairs — Named Actions for Account Team
| Rank | Product A | Product B | Orders Together | A-only customers | B-only customers |
|---|---|---|---|---|---|
| 1 | Party Bunting | White Hanging Heart T-Light Holder | 279 | 453 | 601 |
| 2 | Assorted Colour Bird Ornament | White Hanging Heart T-Light Holder | 271 | 439 | 619 |
| 3 | Jumbo Bag Red Retrospot | White Hanging Heart T-Light Holder | 252 | 413 | 634 |
| 4 | Regency Cakestand 3 Tier | White Hanging Heart T-Light Holder | 234 | 618 | 595 |
| 5 | Regency Cakestand 3 Tier | Assorted Colour Bird Ornament | 230 | 630 | 427 |
For a strategic acquirer, the product affinity data answers a due diligence question that transaction data alone cannot answer: what is the natural cross-sell structure of this customer base? The co-purchase pairs represent customer behavior that already exists — these are not projected preferences, they are documented purchasing patterns. An acquirer with a broader catalog than this business can use the same affinity structure to introduce its own products to established customers. For valuation purposes, this represents genuine upside above the LTV projections in LTV Methodology through CAC & Regional, which are based solely on the existing catalog.
This combined heatmap is the whole-business view — useful for spotting cross-segment product bridges, but the co-occurrence counts are dominated by UK volume (3,914 UK accounts vs 414 international accounts), so international purchasing patterns are systematically under-weighted in the combined ranking.
The Product Affinity — UK Top 10 subsection at the end of C.2 is the operationally correct reference for UK cross-sell programs: it uses only UK customer transactions, so the pairs and intensities reflect what UK accounts actually buy together. The Product Affinity — International Top 10 subsection at the end of C.3 is the operationally correct reference for international cross-sell programs: international accounts buy a different catalog from UK accounts (only 1 product overlaps in the top 10), so the international affinity matrix is structurally different from the UK matrix.
Where a product pair appears in the UK or international chart but not in the combined chart (or vice versa), the segment-specific chart is authoritative for that segment’s account team. Cross-sell programs built on the combined view will systematically under-serve international purchasing patterns because UK volume dominates the co-occurrence counts.
Author: Shawn Phillips | Lailara LLC
← Appendix B — Account Investigation Briefs | Appendix D — Dead Stock Analysis →