3 Customer Segmentation
3.1 Three Distinct Groups
To understand this business, customers need to be divided not by geography but by whether the company knows who they are. The revenue base falls into three commercial segments:
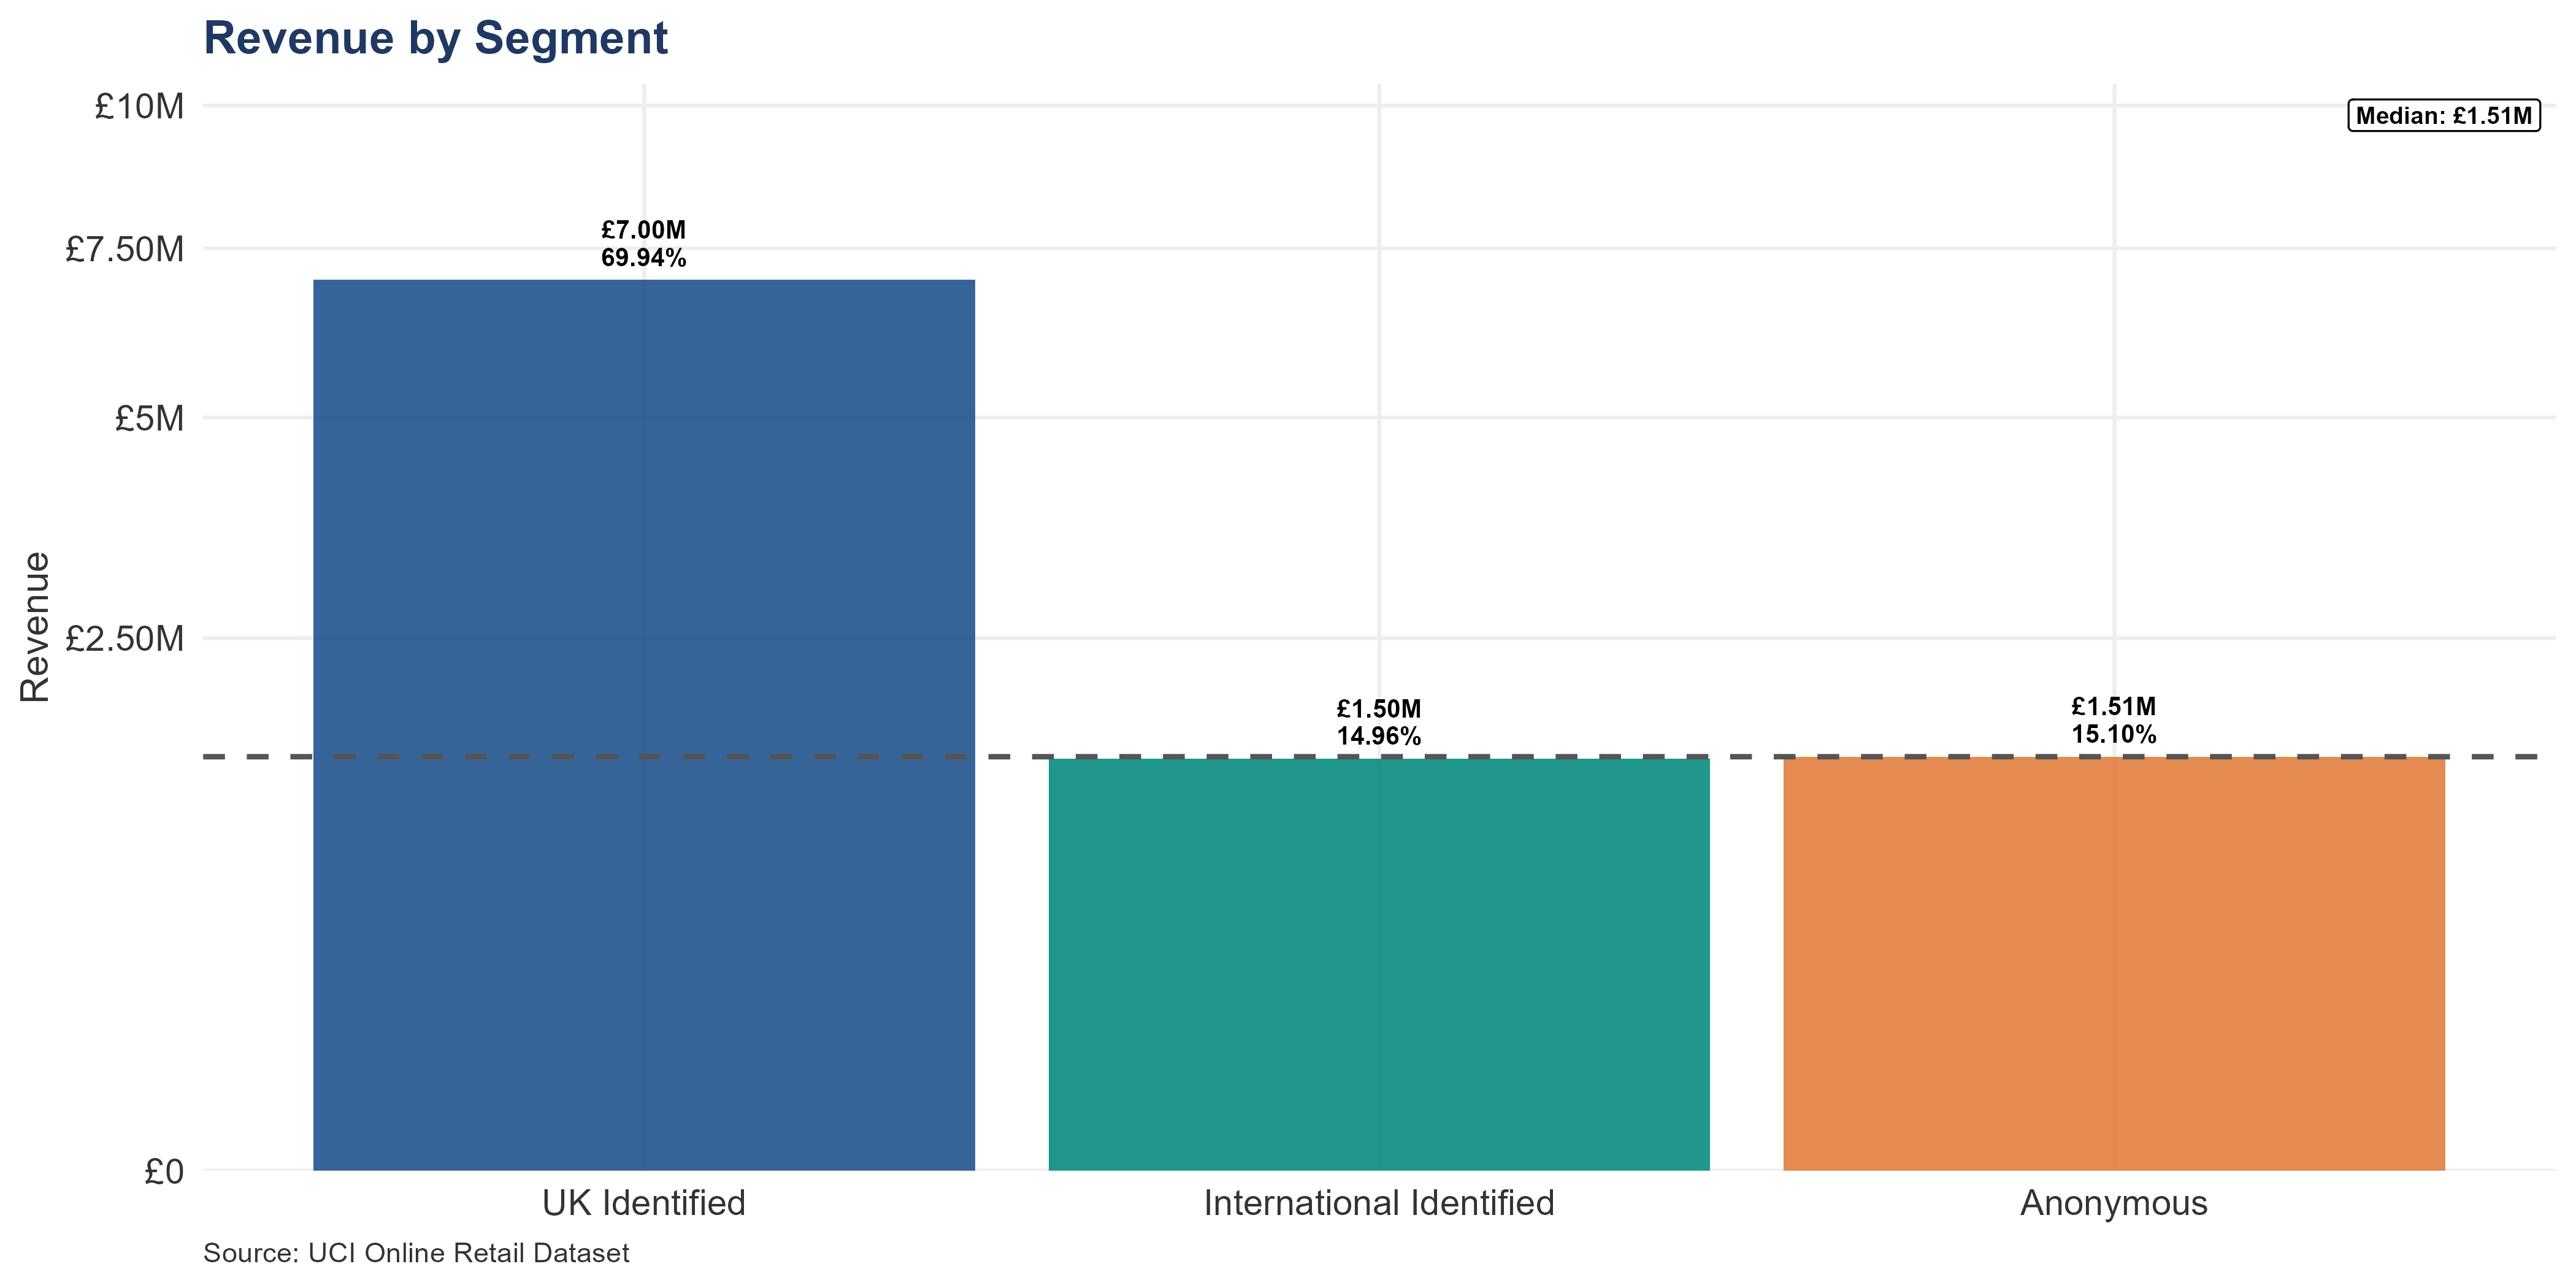
UK Identified — the core. The largest segment: 3,914 accounts generating £7.00M in gross revenue. These customers can be contacted, their purchasing patterns can be analyzed, and their lifetime value can be modeled.
International Identified — higher value, higher risk. A much smaller group (414 accounts) generating £1.50M in gross revenue, but with significantly stronger per-account economics. They spend more per order and hold higher lifetime value. The catch: revenue is heavily concentrated in a handful of accounts, creating serious risk if any one relationship breaks down.
Anonymous — the invisible revenue stream. Orders with no customer ID attached, accounting for roughly 6.93% of all invoices and £1.51M in gross revenue. Their average order size of £1.10K is the highest of any segment. These are real, high-spending customers — but the business cannot contact, retain, or analyze any of them.
This segmentation reflects commercial reality, not just a data classification choice. An anonymous order from London and an anonymous order from Tokyo present the same problem: the business has no visibility into who placed it, whether they have ordered before, or whether they will order again.
3.2 Following the Money
NoteUK Geographic Data Limitation
The dataset contains no sub-national geographic field for UK accounts. Every UK transaction records only “United Kingdom” — no postcode, region, city, or territory. Territory-based analysis is not possible from this data alone.
At first glance, the UK market dominates everything. UK Identified customers deliver 69.94% of total net revenue.
The remaining share is where it gets interesting. International Identified brings in 14.96%, and Anonymous orders account for 15.10%. That the two are nearly equal is striking — the business has an invisible revenue stream roughly matching the size of its entire known international operation.
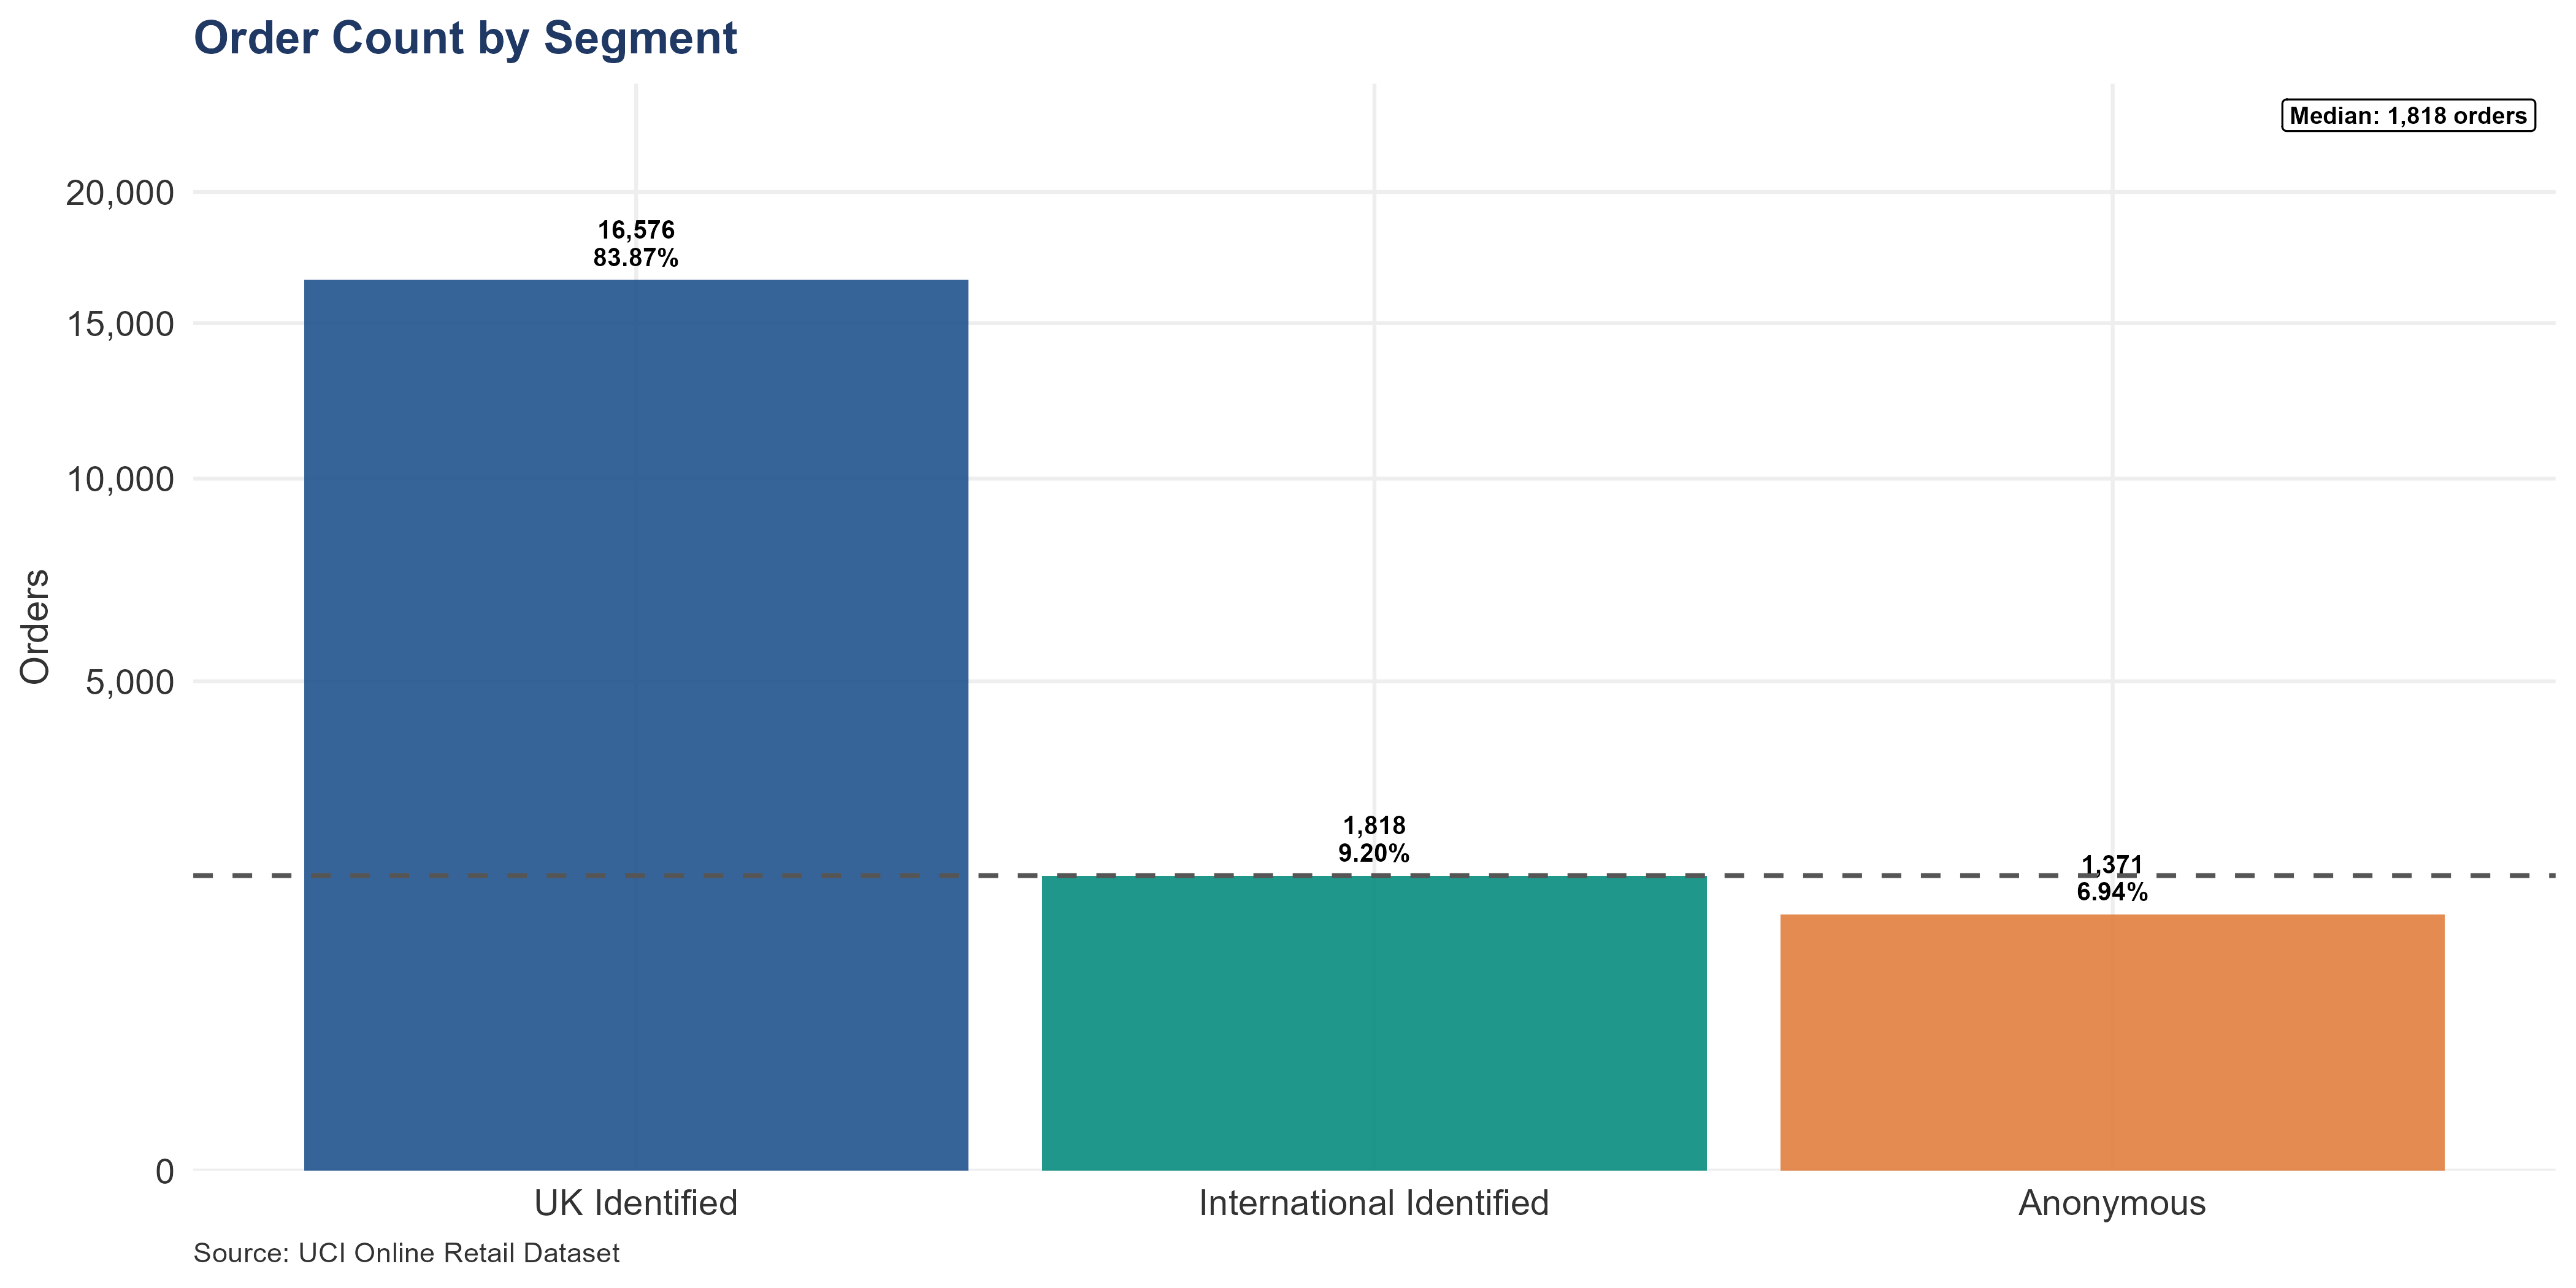
Looking at revenue share alongside order volume reveals which customers are the most efficient spenders. International customers generate 14.96% of revenue from just 9.20% of orders — they spend significantly more per transaction. The anonymous group is even more efficient: 15.10% of revenue from just 6.94% of orders.
Anonymous customers also place a disproportionate share of the business’s largest single orders. Their mean order value of £1.10K is roughly three times the median, meaning a small number of very large bulk purchases are pulling the average up. For an acquirer, converting this invisible revenue into identified, manageable revenue is the fastest path to adding trackable value to the company.
3.3 The International Footprint
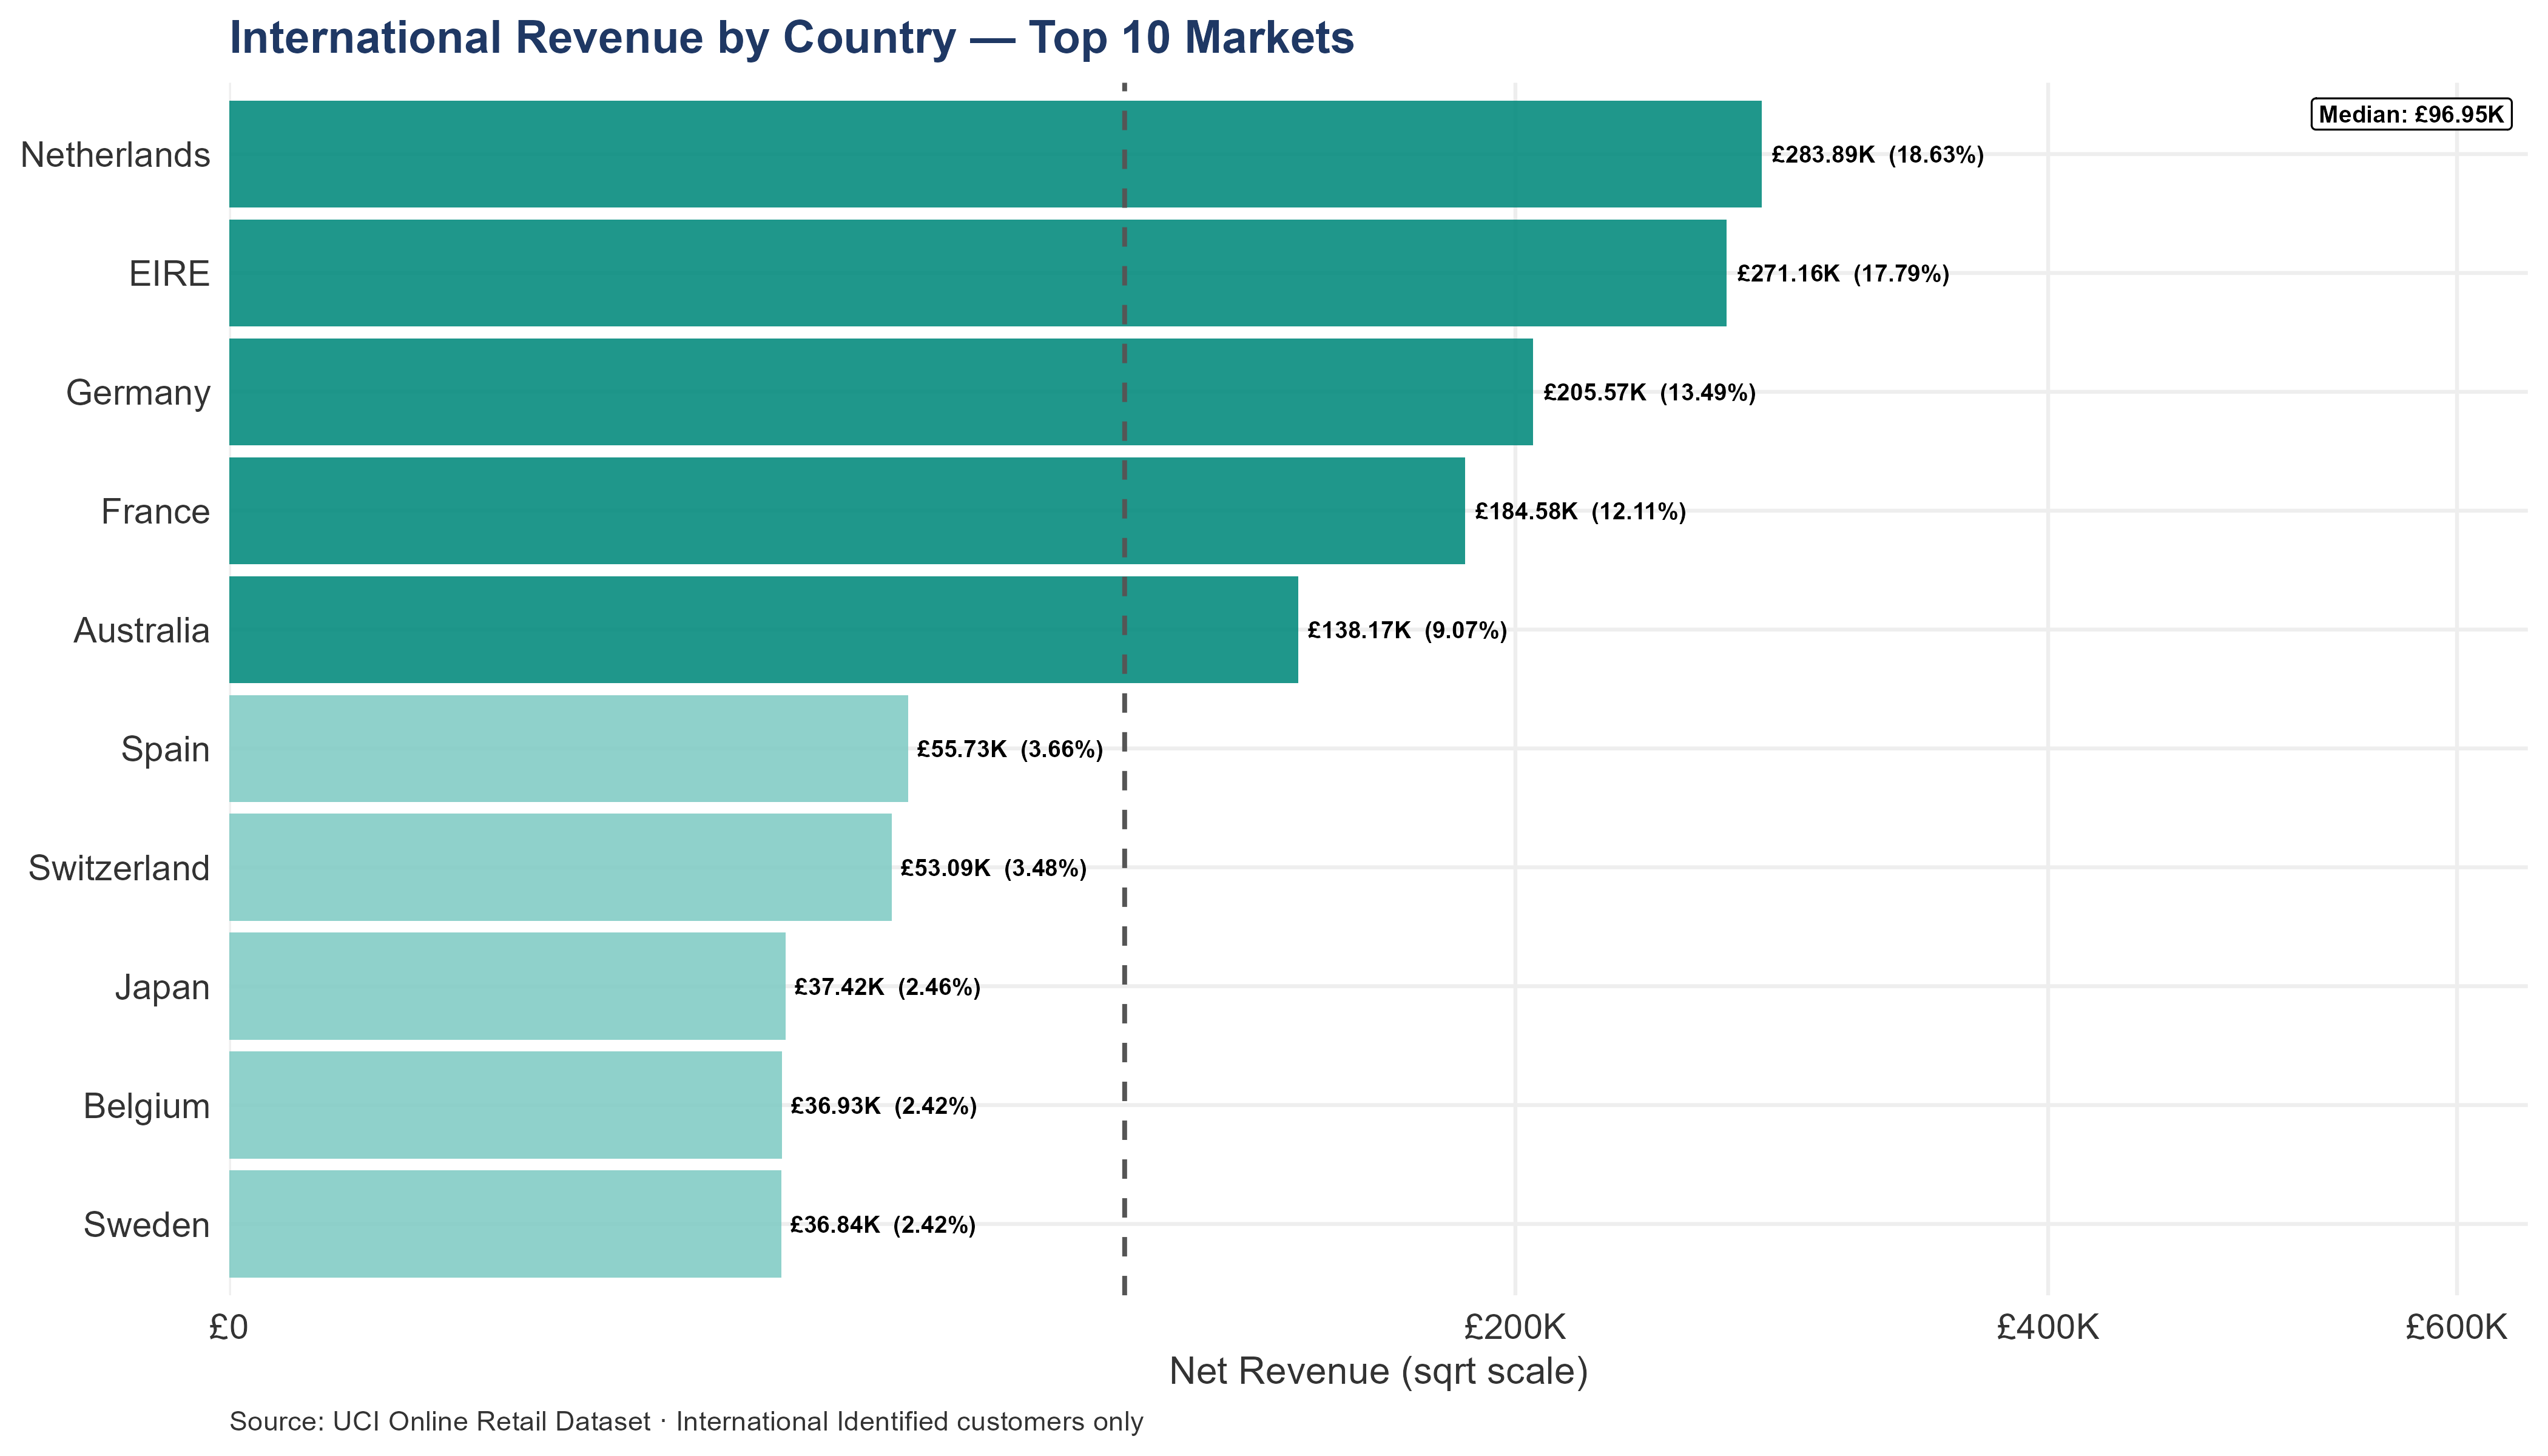
International revenue is heavily concentrated geographically. Five countries — the Netherlands, EIRE, Germany, France, and Australia — generate 71.09% of the segment’s total.
A buyer with existing logistics infrastructure in any of these top markets could serve these accounts at lower cost, immediately improving margins without changing the price list.
| Country | Accounts | Revenue | % of Intl | Median Rev/Account |
|---|---|---|---|---|
| Netherlands | 9 | £283.89K | 18.63% | £31.54K |
| EIRE | 3 | £271.16K | 17.79% | £90.39K |
| Germany | 94 | £205.57K | 13.49% | £2.19K |
| France | 87 | £184.58K | 12.11% | £2.12K |
| Australia | 9 | £138.17K | 9.07% | £15.35K |
| Spain | 30 | £55.73K | 3.66% | £1.86K |
| Switzerland | 21 | £53.09K | 3.48% | £2.53K |
| Japan | 8 | £37.42K | 2.46% | £4.68K |
| Belgium | 25 | £36.93K | 2.42% | £1.48K |
| Sweden | 8 | £36.84K | 2.42% | £4.61K |
3.4 The Anonymous Segment — A Closer Look
The anonymous segment is a commercial paradox. It generates £1.51M in gross revenue — comparable in scale to the entire international segment. Yet the business cannot contact, retain, or model a single one of these customers.
With a mean order value of £1.10K, these are clearly established wholesale accounts, not casual retail shoppers. A median order value of £362 confirms the same thing from a different angle — this is business-to-business purchasing. The company is processing these orders, shipping the goods, and collecting the money, but it has no way to build on any of it. Every anonymous order is commercially unactionable regardless of its size.
Important
The Primary Risk
£1.51M in annual revenue has no retention infrastructure attached to it. A valuation model cannot guarantee this revenue will transfer to a new owner.
3.4.1 The Commercial Picture
Anonymous orders account for 6.93% of all orders and 14.71% of gross revenue — 1,371 orders generating £1.51M with no CustomerID attached. That makes this segment comparable in scale to the entire international identified operation, except that none of it can be retained, contacted, or modeled. An LTV projection that excludes anonymous customers understates the forward revenue opportunity by the full conversion upside of this segment. A valuation that treats anonymous revenue as a permanent component of gross revenue overstates the retainable base, since no identified customer stands behind any of it.
These are not incidental retail purchasers. The median anonymous order value is £362 — wholesale-level spend. The mean of £1.10K, the highest of any segment, is pulled upward by a small number of very large orders, but even the median confirms these are material business-to-business transactions. The question the data cannot answer is whether these are repeat relationships that would survive an ownership transition. Without identity, there is no way to know — and no way to protect the relationship if they decide to move on.
96.43% of anonymous orders originate from the United Kingdom — this is a domestic process problem, not a geographic mystery. These customers are almost certainly reachable through standard UK commercial channels. The anonymity is consistent with a process gap in CustomerID capture, though verification requires auditing the order entry channels pre-close. The resolution program is primarily a domestic IT and process change, not a complex international outreach campaign — tractable and low-cost relative to the revenue at stake.
The anonymous order rate is declining between H1 and H2 — a positive signal, but the absolute volume still warrants a formal resolution program. H1: 8.48% of orders. H2: 5.87%. A stable or growing rate means the problem will be larger at close than it is in this dataset. Every month the process gap remains open adds more anonymous orders to the backlog the resolution program must work through post-close.
In effect, the anonymous segment is a second revenue channel the size of the International Identified segment, operating without any of the identity infrastructure that makes the International segment manageable. Anonymous gross revenue (£1.51M) is comparable in scale to International gross revenue, but International accounts have names, countries, reorder histories, cancellation patterns, and named-owner potential. Anonymous revenue has none of that. Every analytical technique applied to the other segments — LTV modeling, reorder interval analysis, retention curves, tier-based outreach — is unavailable here until the CustomerID gap is closed. The resolution program is not a retention optimization; it is the prerequisite for applying any retention optimization to this segment at all.
3.4.2 What the Business Loses from Anonymous Orders
Without a customer ID, the business cannot determine whether an anonymous customer has ordered before or will order again. It cannot calculate their lifetime value, contact them for follow-up, assign them to a segment, track their cancellation patterns, or project their future demand. Every analytical tool available for the other segments — LTV modeling, retention curves, reorder analysis, tier-based management — is completely unavailable for anonymous revenue.
The anonymous segment contains every transaction where the CustomerID field is empty. These are not a separate customer type — they are orders where no CustomerID was recorded. Some may be first-time purchasers who were never offered an account. Some may be existing identified accounts who bypassed the CustomerID field on a specific order. Some may be orders entered through channels that do not require account creation. The transaction record is silent on which of these cases applies.
Without a CustomerID, the business cannot manage retention (no way to tell if an anonymous customer has ordered before or will order again), cannot compute lifetime value, cannot contact customers for follow-up or cross-sell, cannot assign them to a segment, cannot build an account-level cancellation profile, and cannot project forward demand from unidentifiable sources.
| Metric | Anonymous | UK Identified | Intl Identified |
|---|---|---|---|
| Orders | 1,371 | 16,576 | 1,818 |
| Gross Revenue | £1.51M | £7.00M | £1.50M |
| % of Total Revenue | 14.71% | 68.25% | 14.60% |
| Median AOV | £362 | £299 | £391 |
| Mean AOV | £1.10K | £422 | £823 |
| Cancellation Rate | 0.29% | 2.78% | 2.10% |
| Note: | |||
| Anonymous cancellation rate is structurally low — credit notes cannot be attributed to anonymous orders without a CustomerID. |
Anonymous customers are placing orders at values consistent with wholesale relationships. A median AOV of £362 is not a casual consumer purchase — it is a business transaction. The business is processing these transactions, fulfilling them, and collecting the revenue — but it has no way to build on them. Each anonymous order is commercially unactionable, regardless of how much revenue it generates.
3.4.3 Is the Problem Getting Better or Worse?
The anonymous order rate month by month shows whether the identity-capture gap is stable, improving, or worsening over the analysis period.
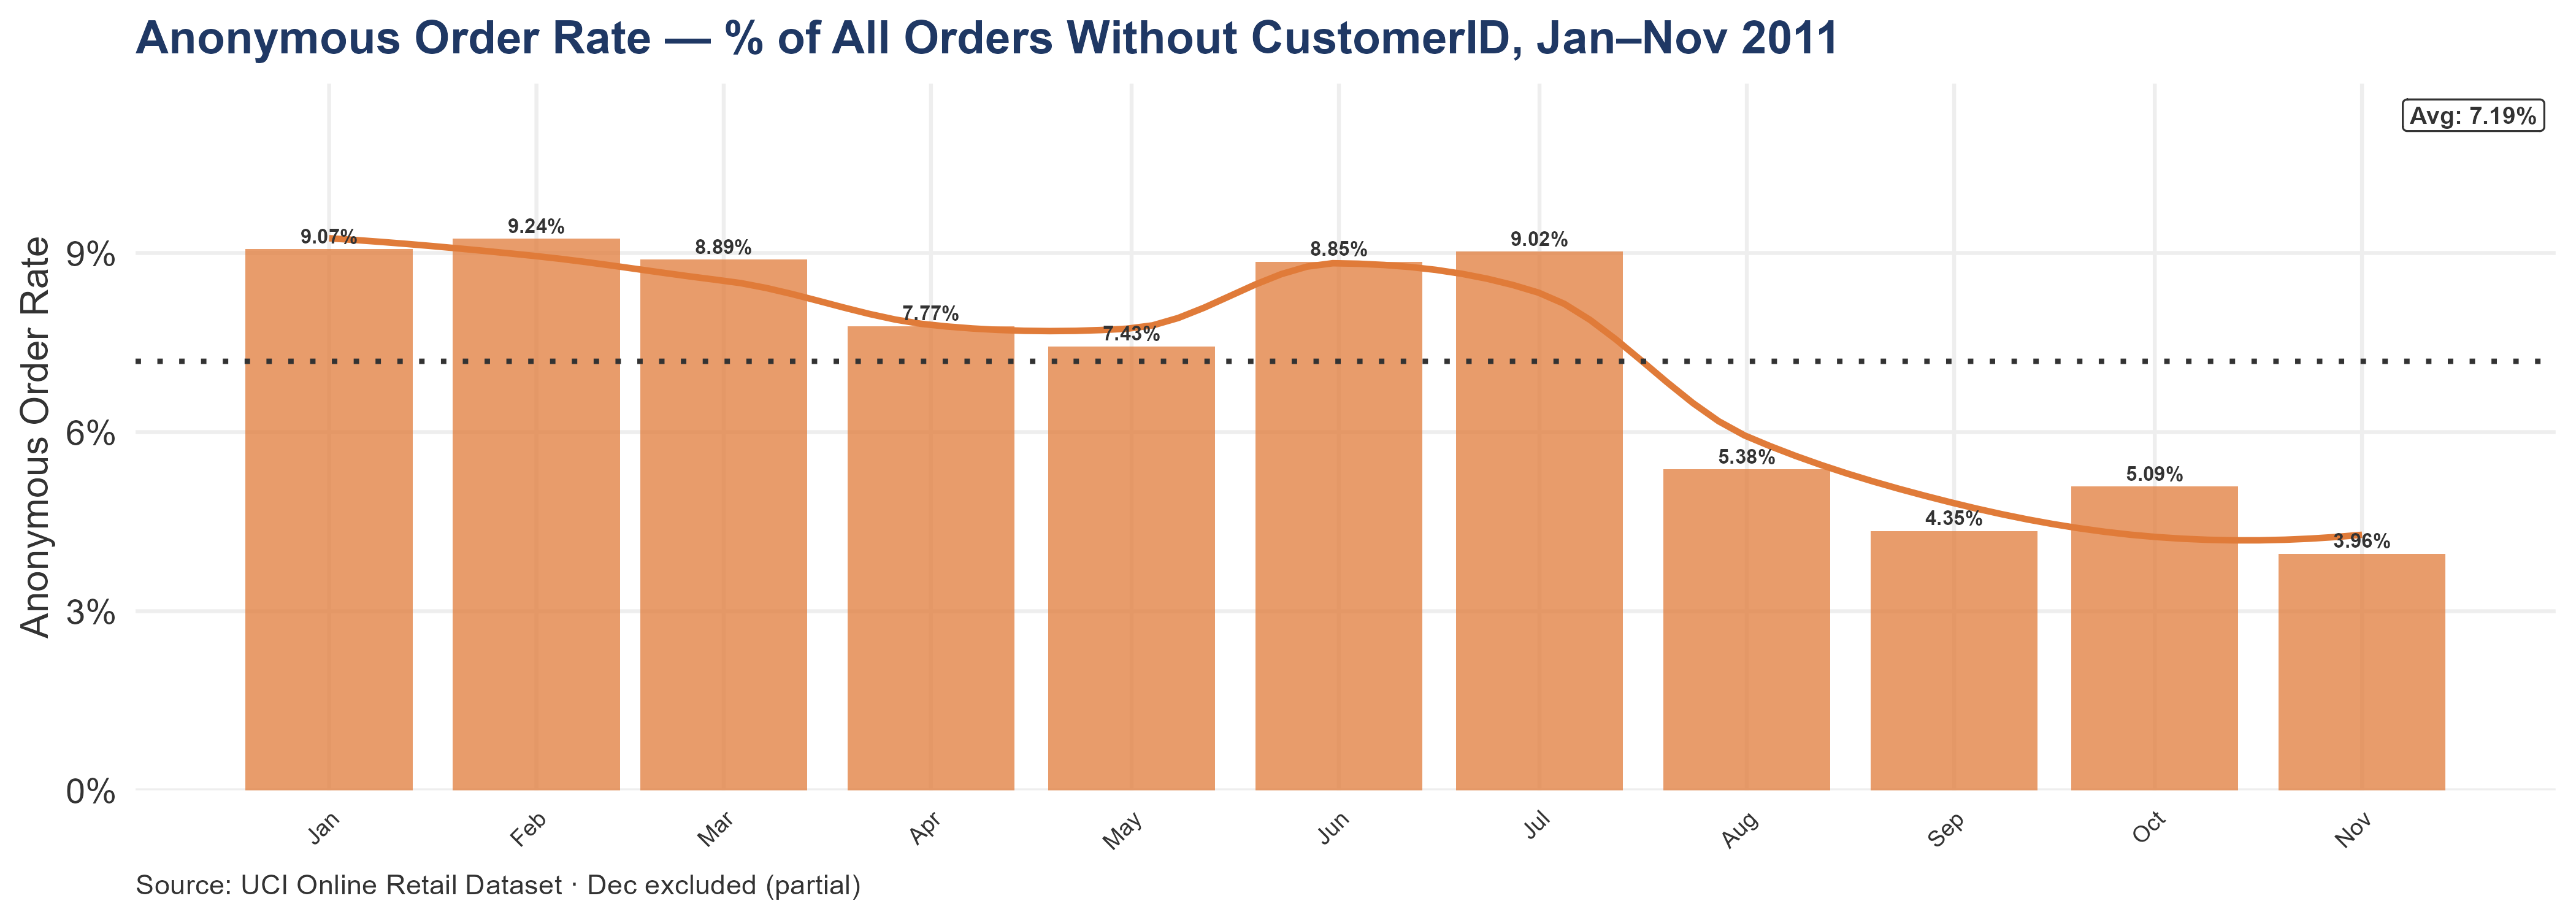
The anonymous order rate is declining across 2011. The period-total rate (total anonymous orders ÷ total orders) is 6.93%; the average of monthly rates is 7.19% — both figures are correct on their own terms. H1 rate: 8.48%. H2 rate: 5.87%. A declining rate is positive, but the absolute volume of 1,371 orders still represents a material commercial blind spot. Without active intervention the gap closes too slowly to recover the next 24 months of forward LTV.
The trend direction determines valuation treatment. A stable or rising rate means the acquirer inherits a growing blind spot — apply a retention discount to anonymous revenue in the valuation model (60–70% of historical rate as forward assumption). A declining rate suggests partial self-correction, but the resolution program is still required to close the gap before it stabilises at an unacceptable level.
3.4.4 When Do Anonymous Orders Happen?
Anonymous orders cluster at the same times and days as identified orders. If these were a different type of customer — late-night retail browsers, for example — the timing would look different. It does not. These are normal wholesale customers buying through a process that is systematically failing to record their identity.
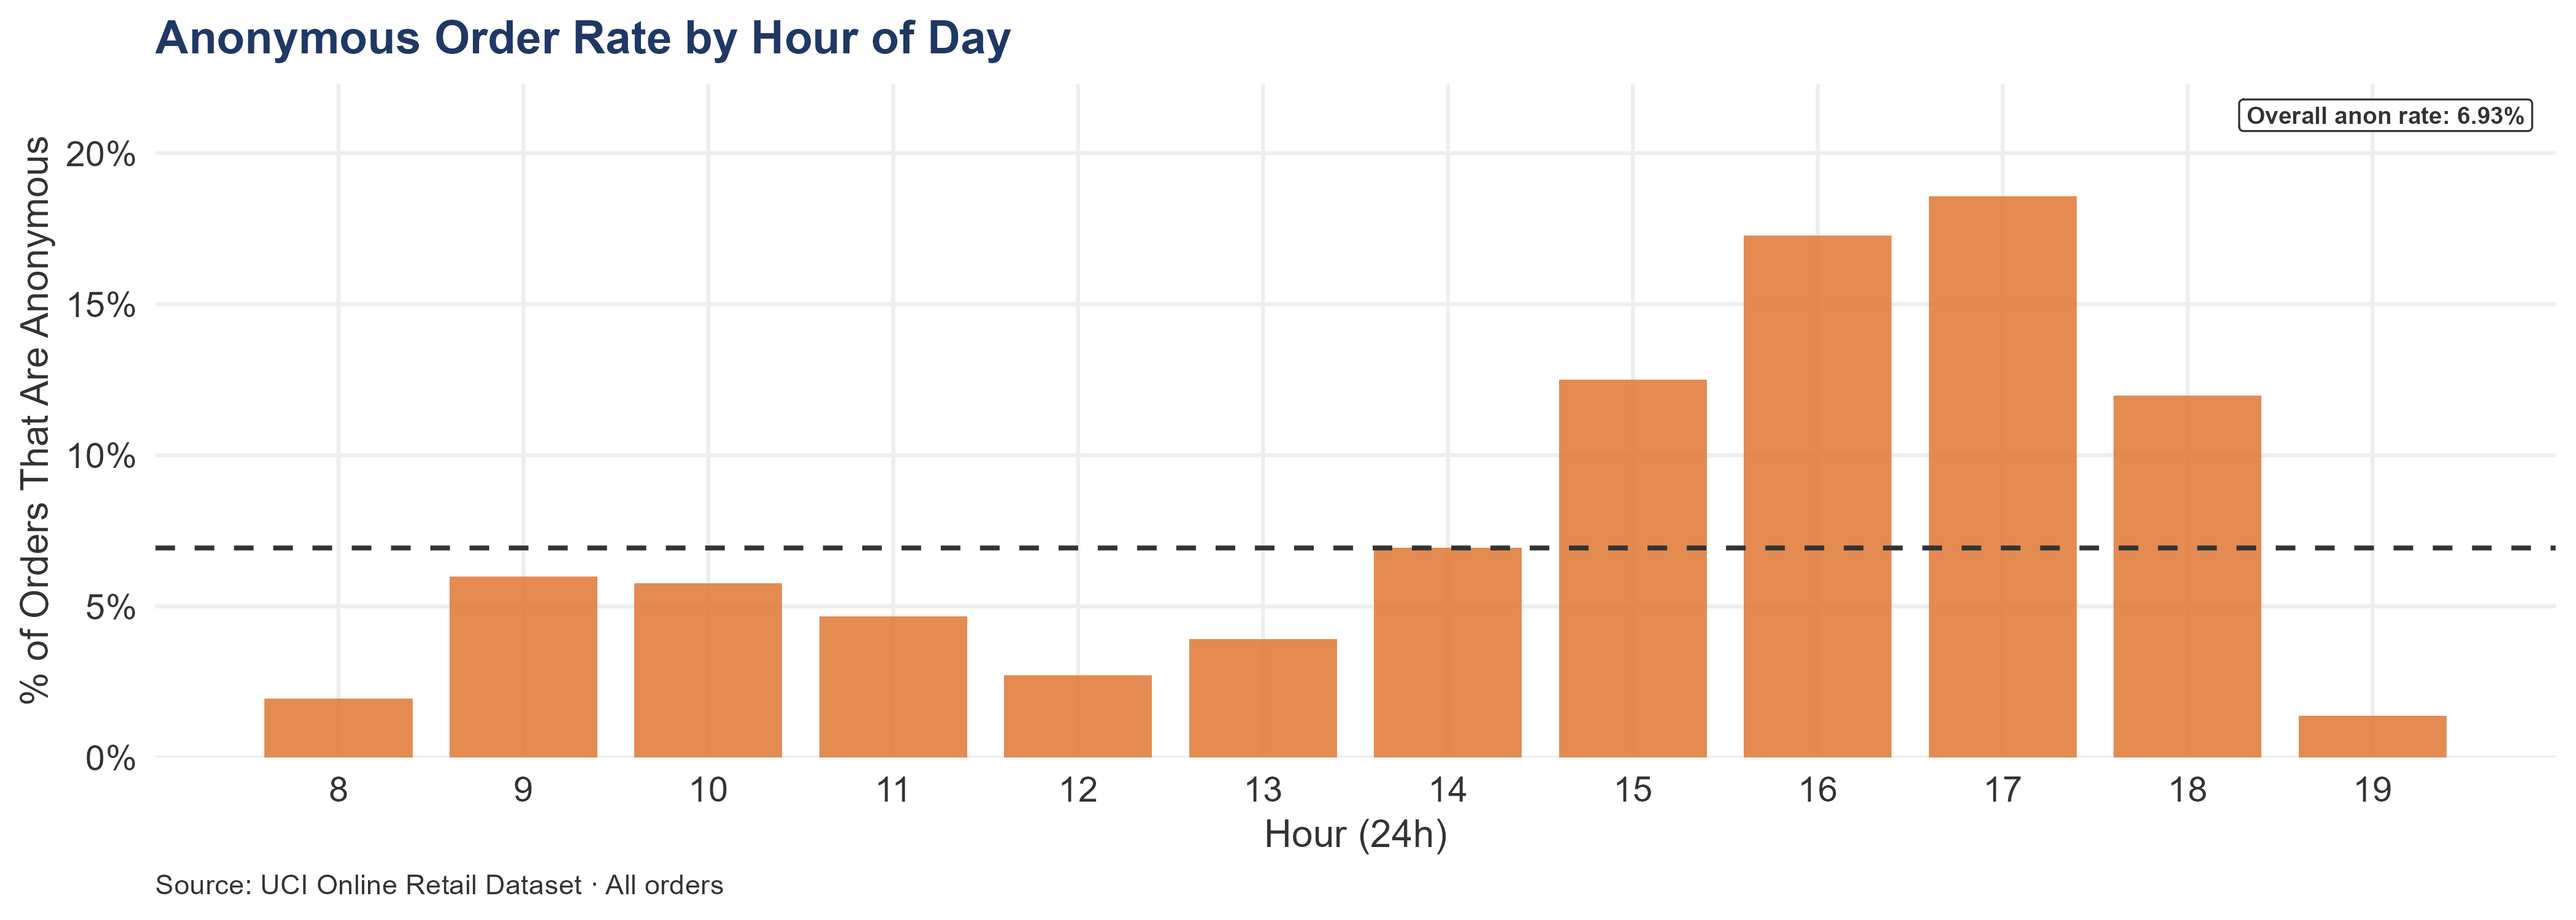
The anonymous rate peaks at 17:00 (18.58% of 662 orders in that hour are anonymous) and is lowest at 19:00 (1.38% of 145 orders). Sample-size context matters here: hours with low total-order counts can produce extreme rates from a handful of orders, so the peak hour’s 662-order base is the relevant denominator. The concentration at specific hours suggests a channel or staffing pattern — if the high-anonymous hours correspond to periods when order-taking staff are reduced, the CustomerID capture step may be getting skipped under time pressure. Auditing the order entry process during the peak anonymous hours would narrow the diagnosis.
Hour-of-day concentration points to the specific channel or process to fix. Pre-close, requesting the order entry system’s channel-by-channel log would confirm which entry pathway generates the peak-hour anonymous orders and narrow the IT fix scope considerably.
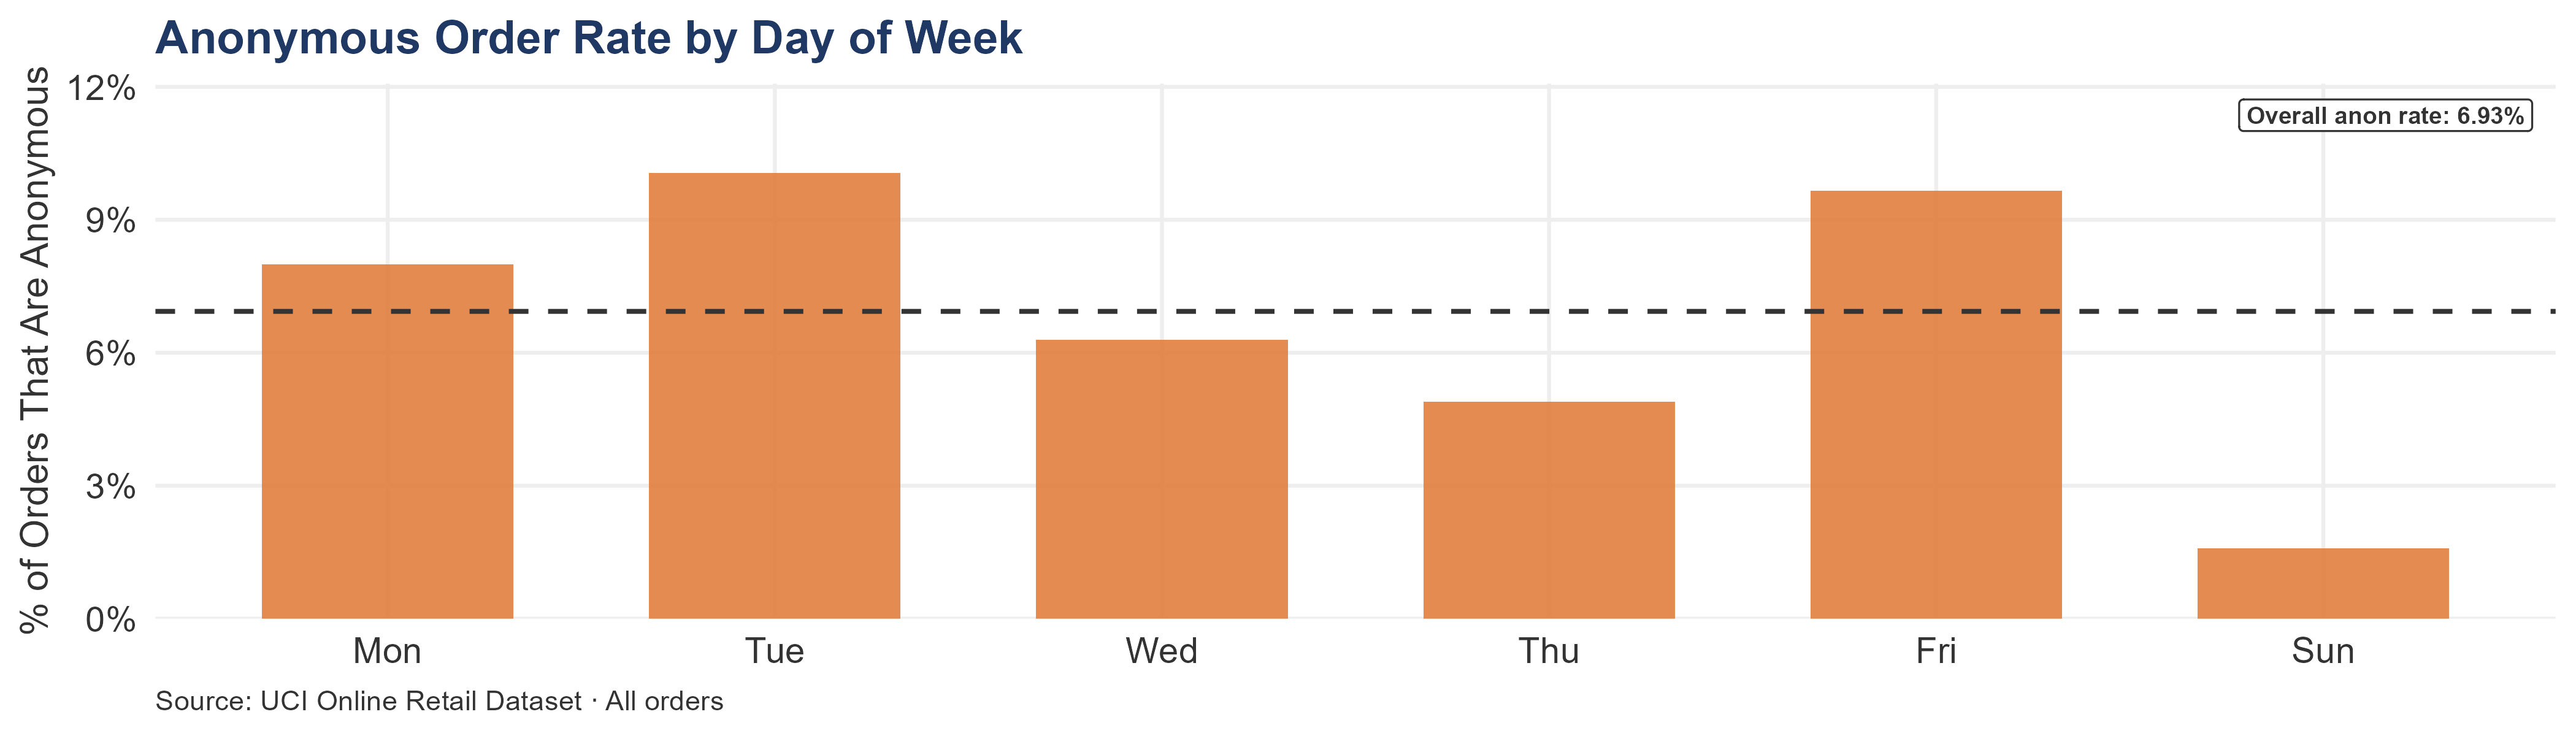
The anonymous order rate is highest on Tue (10.06% of orders are anonymous) and lowest on Sun (1.59%). The anonymous rate is broadly consistent across weekdays, pointing to a persistent process issue across all working days rather than a day-specific scheduling gap. Day-of-week concentration is the cheapest channel diagnostic available: cross-referencing peak-anonymity days with staffing schedules and channel logs would identify whether a particular route (phone, fax, email, web) drives the volume. That is a one-day investigation that costs nothing pre-close.
The concentration at specific hours and days points toward a channel or staffing pattern. If the highest-anonymity hours correspond to periods when fewer staff are processing orders, the customer ID step may be getting skipped under time pressure. Identifying the specific channel or time window where the problem concentrates is a straightforward pre-close investigation.
3.4.5 Where Do Anonymous Orders Come From?
United Kingdom: £1.48M (1,322 orders) — 98.10% of anonymous revenue. UK is shown separately so the remaining markets are readable on their own scale.
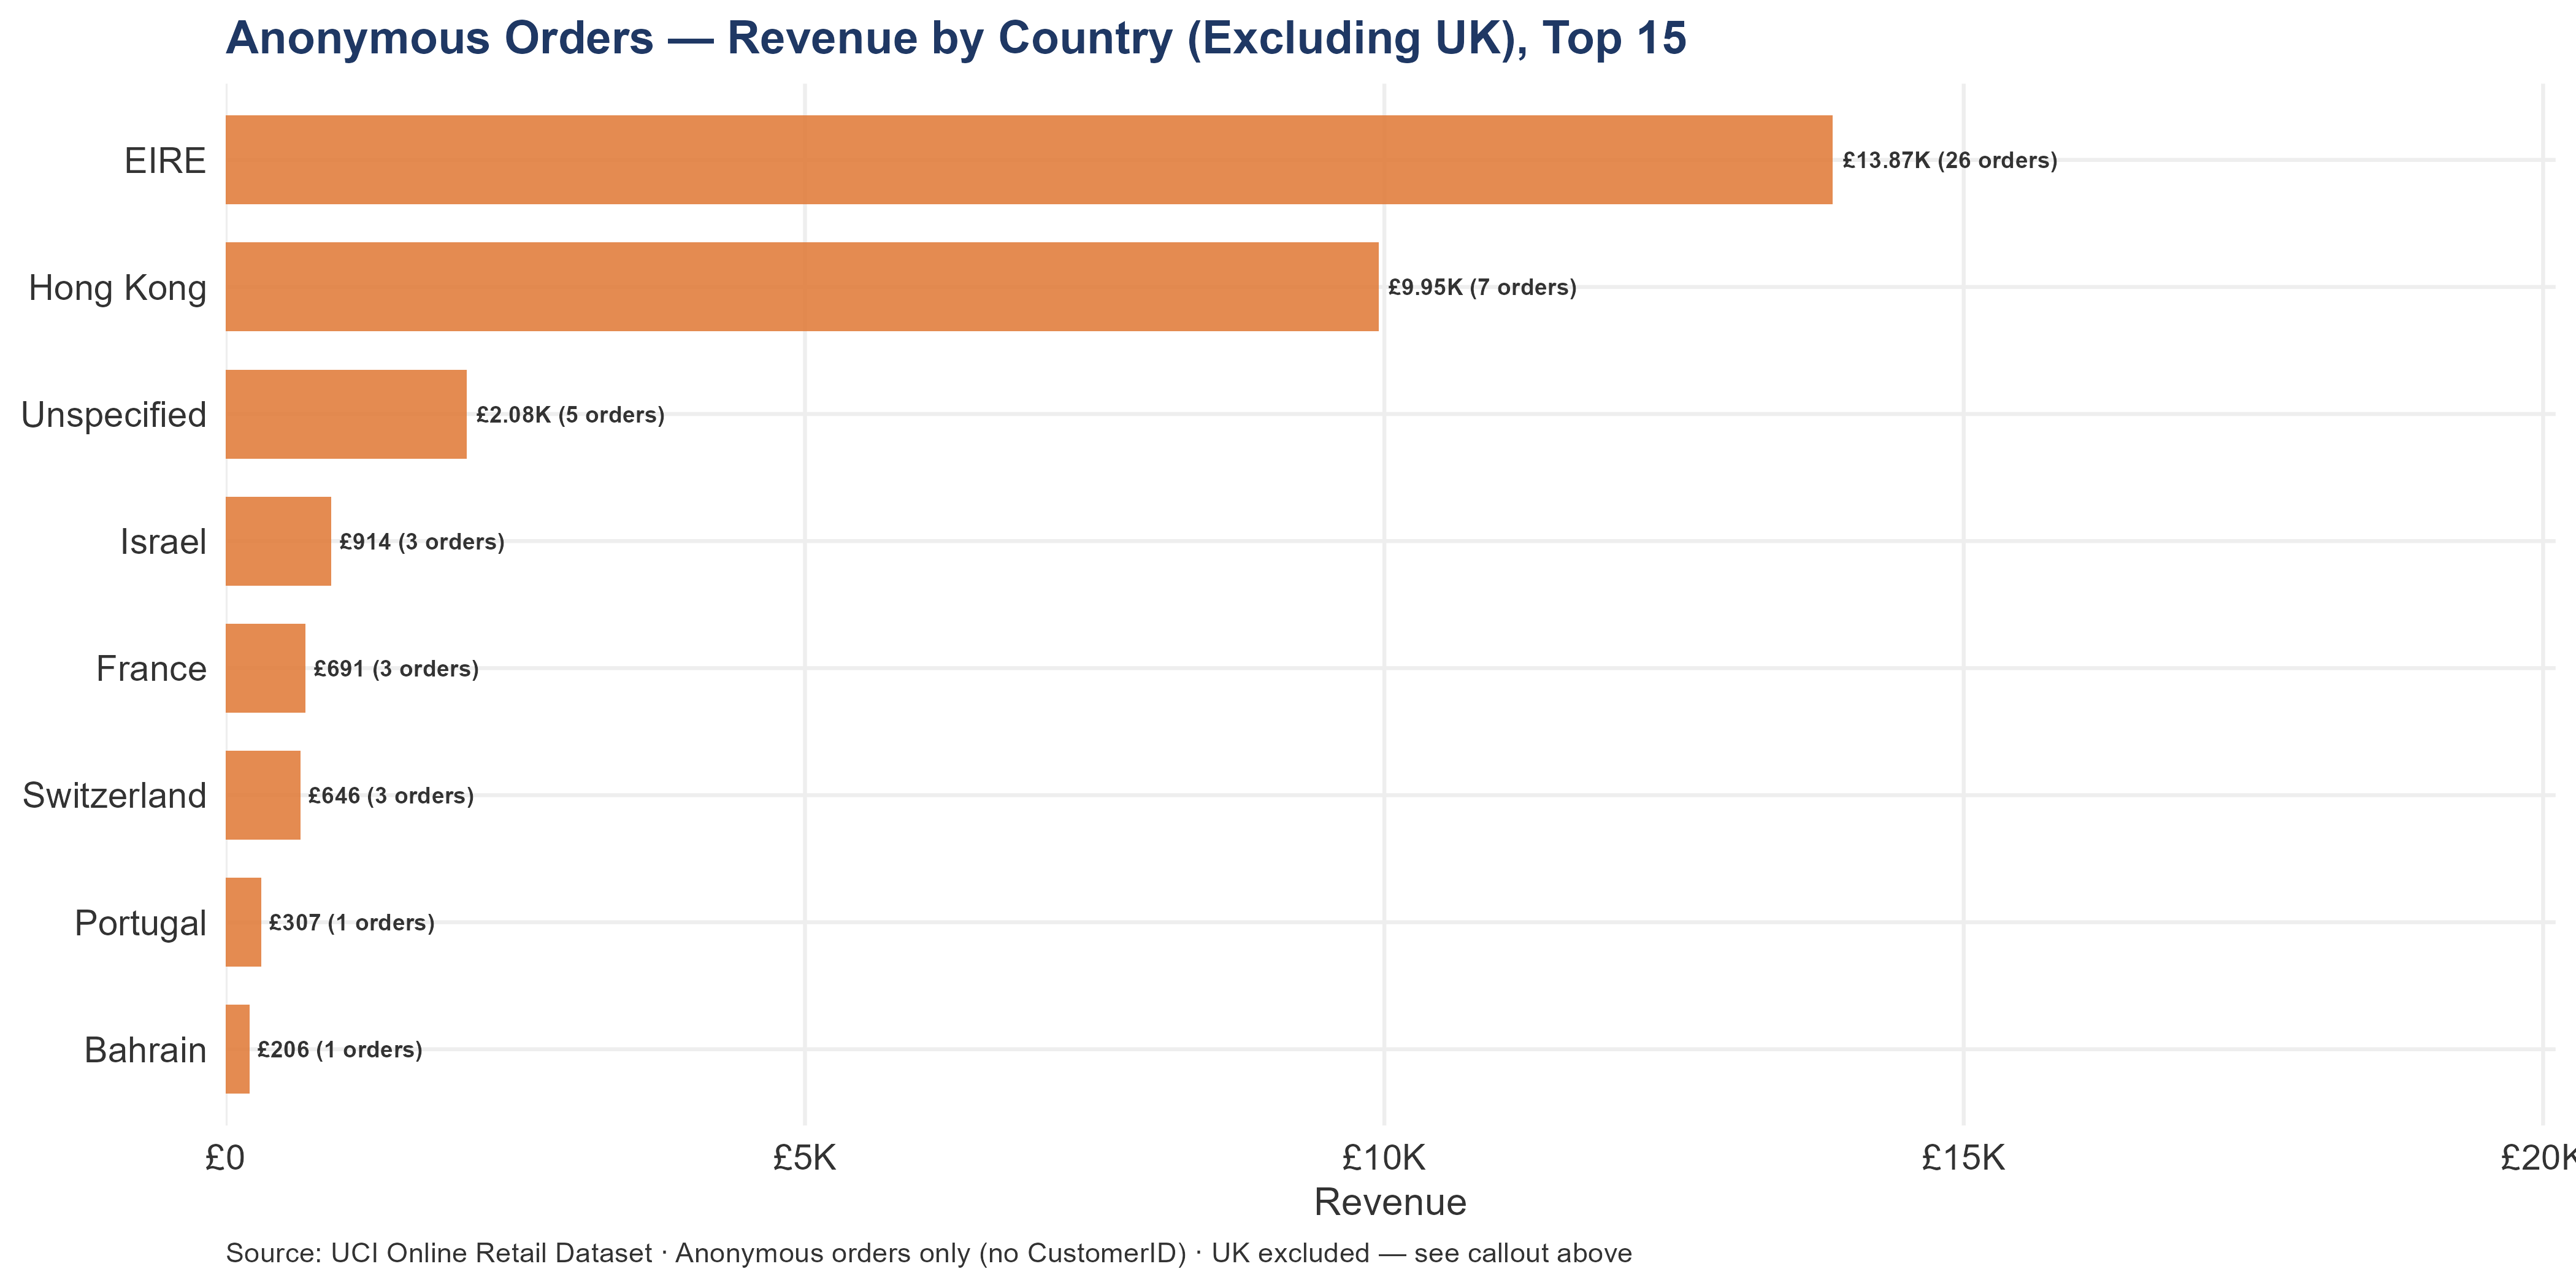
96.43% of anonymous orders come from the United Kingdom. The remaining 3.57% are from 8 international markets: EIRE, Hong Kong, Unspecified, Israel, France, Switzerland, Portugal, Bahrain. The dominance of UK anonymous orders means the resolution program is primarily a domestic process fix — these are UK customers who could have been captured as identified UK accounts. The resolution team should focus on UK order entry channels first.
Every UK anonymous order is a missed entry in the UK Identified segment. If the 1,322 UK anonymous orders had been captured with CustomerID, the UK Identified account base would be larger, UK retention metrics more accurate, and UK LTV projections more reliable. The anonymous segment is not a separate market — it is a data quality gap that degrades every other segment’s analysis. Because 96.43% of anonymous orders are UK, the resolution program is primarily a domestic IT and process fix — not an international logistics problem. The scope is narrower and cheaper than the headline £1.51M figure suggests. An acquirer who fixes UK order entry CustomerID capture resolves the vast majority of the problem without touching international systems at all.
96.43% of anonymous orders originate from the United Kingdom. This is not an international routing mystery — it is a domestic process gap. These customers are almost certainly reachable through standard UK commercial channels. The fix is a targeted change to the UK order entry process, not a complex international outreach campaign.
3.4.6 What Are Anonymous Customers Buying?
Product overlap between anonymous and identified segments reveals whether anonymous customers are the same buyer type purchasing through a broken process, or a distinct population with different preferences.
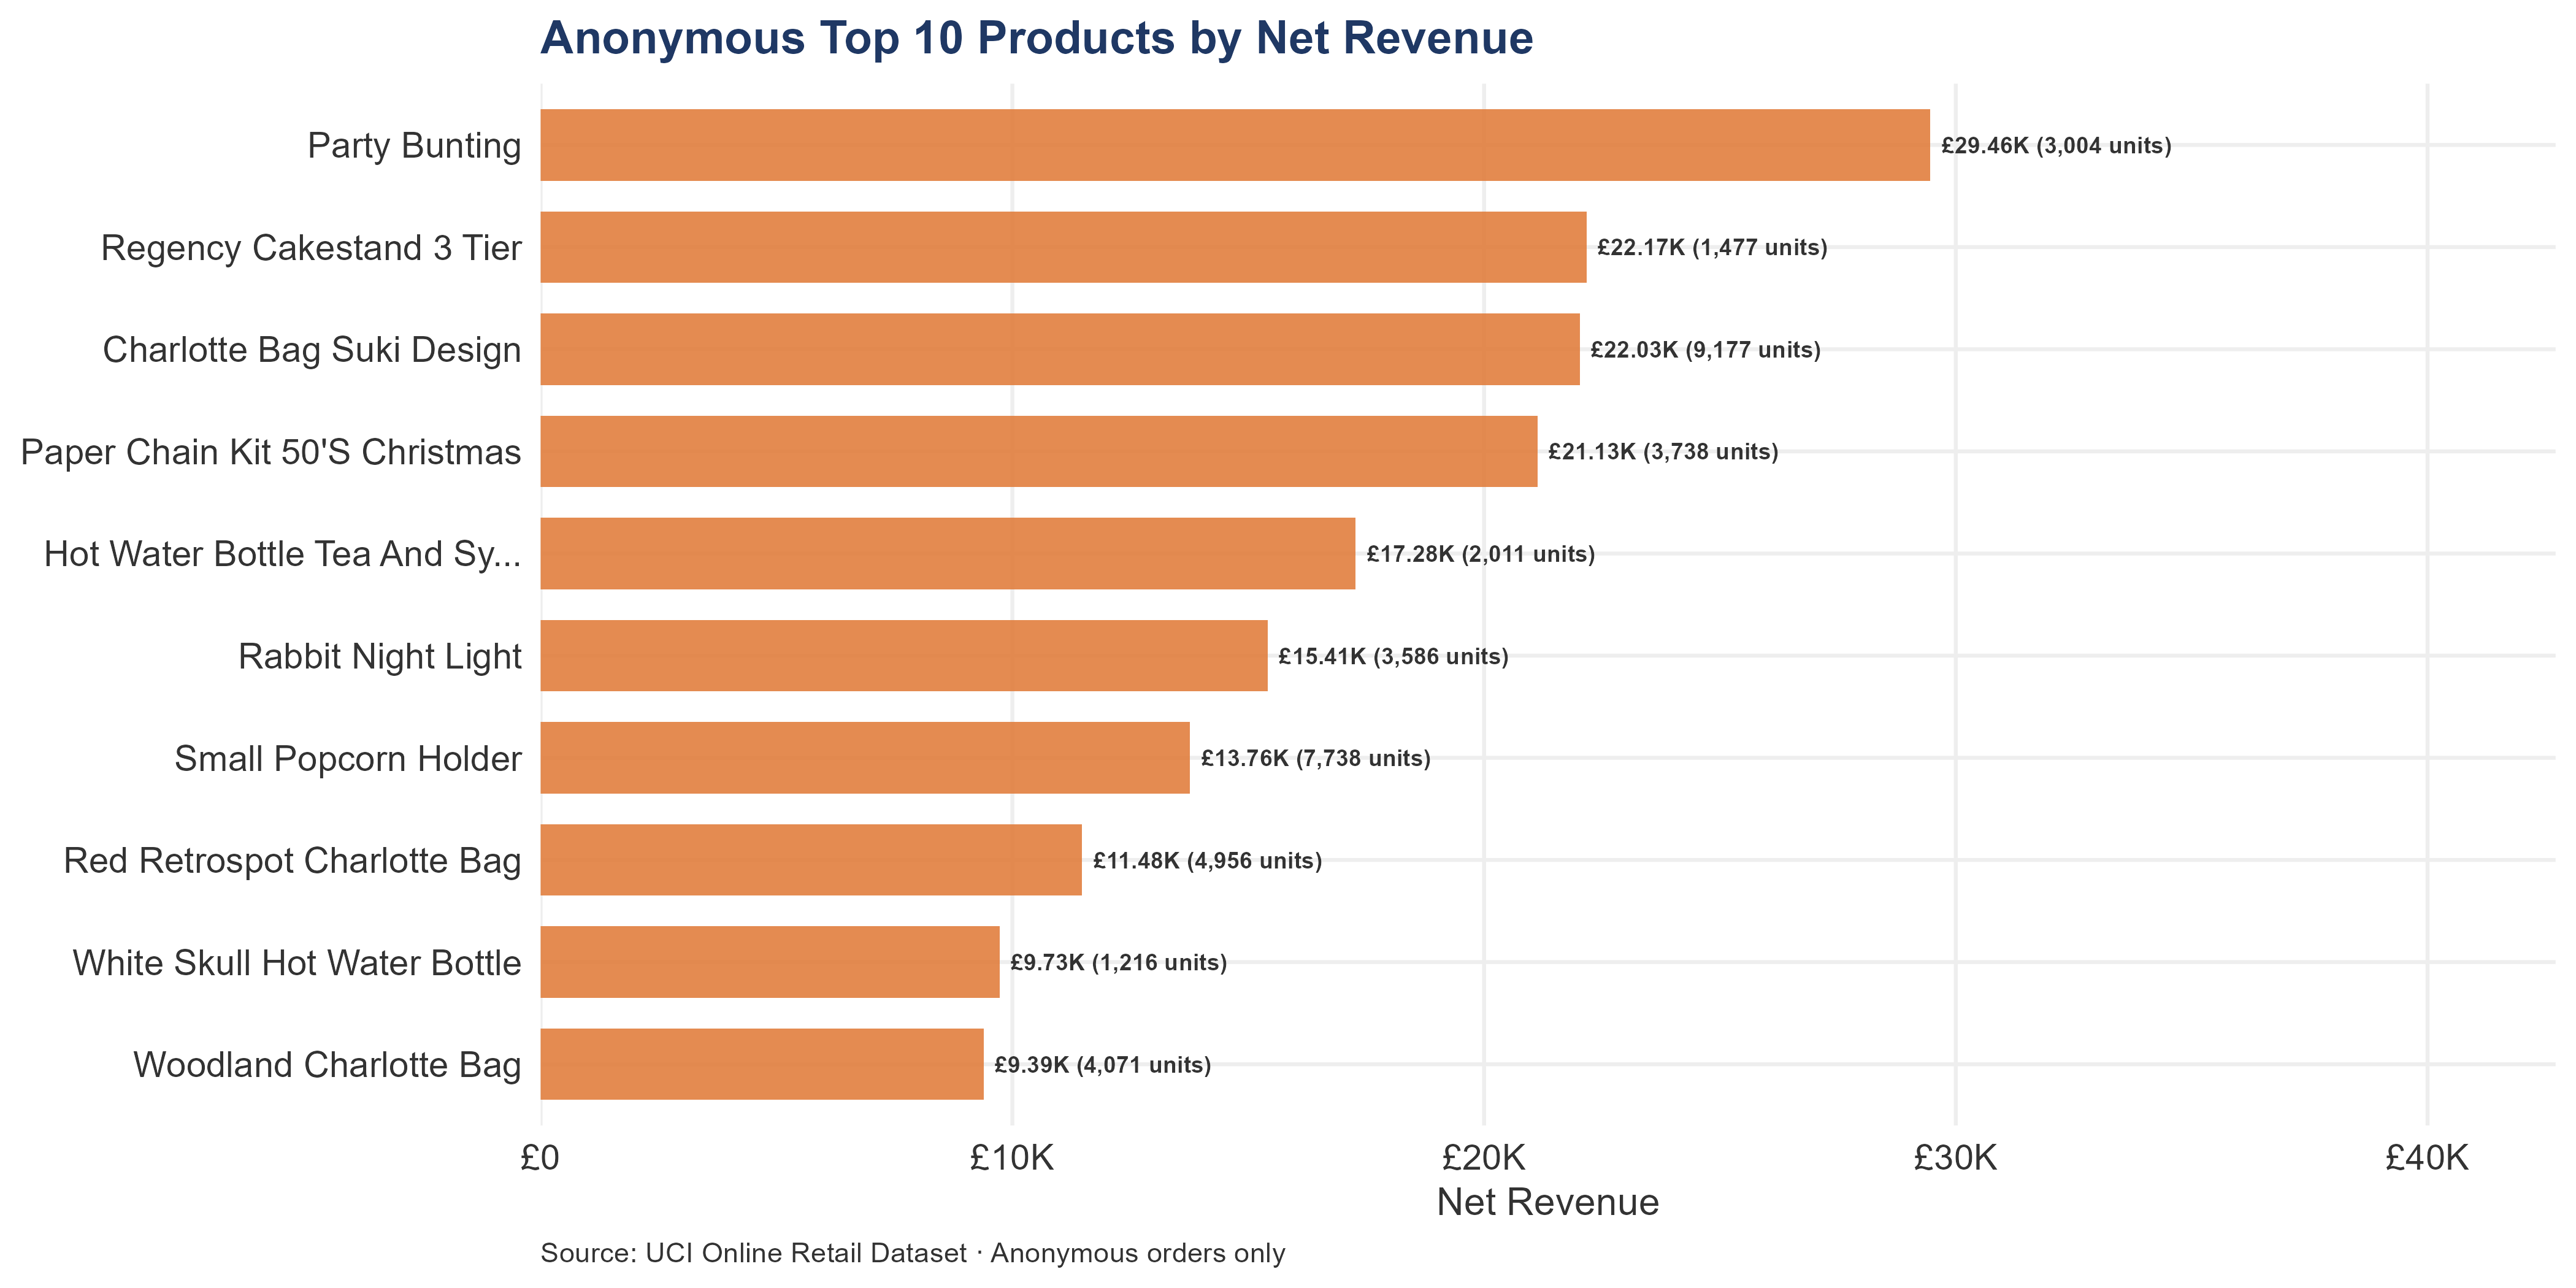
A total of 4 of the anonymous top-10 products also appear in the UK top 10, and 2 overlap with the International top 10. UK-overlap products: Party Bunting; Regency Cakestand 3 Tier; Paper Chain Kit 50’S Christmas; Small Popcorn Holder. Partial overlap — anonymous customers share some product preferences with UK accounts but also buy products not in the UK top 10. This may reflect a mix of UK customers and international customers in the anonymous pool.
Products that appear in both the anonymous and UK top 10 are the strongest candidates for address-matching resolution. A UK address on a high-value anonymous order for a product that UK accounts typically buy is almost certainly an existing UK relationship that bypassed identity capture. Product overlap with the UK top 10 is the resolution program’s highest-confidence starting point. Address-match anonymous orders for these 4 products first — highest match probability, lowest resolution cost. For an acquirer, each resolved order converts from unattributed revenue to a managed relationship with full LTV value. The overlap products define where to start that conversion.
Four of the anonymous top-10 products also appear in the UK top-10 list. This overlap strongly suggests that many anonymous customers are existing UK wholesale accounts whose orders bypassed the identity capture step. These overlapping products are the natural starting point for any address-matching program — a UK address on an anonymous order for a product that UK accounts typically buy is almost certainly a known customer whose identity was not recorded.
3.4.7 Trend Detail — H1 vs H2
| Period | Anonymous Orders | Anonymous Revenue | Anon Rate |
|---|---|---|---|
| H1 2011 | 682 | £506.37K | 8.48% |
| H2 2011 | 689 | £1.00M | 5.87% |
The anonymous order volume held steady from H1 to H2. H2 includes Q4 — the highest-volume ordering period. If the anonymous rate holds steady while total order volume increases in Q4, the absolute number of anonymous orders grows. More anonymous orders during Q4 means more high-value transactions are being processed without identity — precisely when the business needs its commercial intelligence to be sharpest.
H1 and H2 carry nearly identical anonymous order counts (682 vs 689), yet H2 revenue (£1.00M) is close to double H1 (£506.37K). Mean anonymous order value nearly doubled from £742 in H1 to £1.46K in H2 — much larger than the segment-wide mean of £1.10K. This is consistent with Q4 wholesale seasonal purchasing where customers stock up in larger basket sizes for the holiday period. The high H2 mean also explains why anonymous revenue is commercially material despite the lower H2 anonymous rate: fewer anonymous orders, but each one is worth substantially more.
3.4.8 The Quarantined Accounts
(Note: Accounts 16446 and 12346 are not anonymous, but they represent the most extreme data quality issues in the dataset.)
Warning
Accounts 16446 and 12346
Account 16446 invoiced £168.47K but its true net revenue is £3. It ordered over 80,000 units and cancelled them on the same day. Account 12346 shows a similar pattern, with £77.18K in gross revenue dropping to £0 net. Neither account should be treated as a real revenue-generating relationship. Full transaction records are in Appendix B.
Author: Shawn Phillips | Lailara LLC
← Data, Methodology & Executive Summary | UK Customer Landscape →