13 Revenue Concentration Risk
13.1 How Dependent Is the Business on Its Biggest Customers?
Revenue concentration measures how much of the business’s income depends on a small number of accounts. The framework uses three tiers: Healthy (top 10 accounts generate less than 20% of revenue), Moderate (20–35%), and Elevated (above 35%).
A warning about the combined view. At the whole-business level, the top-10 concentration figure sits within healthy ranges. But the combined number is misleading — it blends the UK segment (healthy concentration) with the international segment (elevated concentration) into a single figure that makes the business look safer than it is. The segment-level numbers are the ones that matter for risk assessment.
13.1.1 UK Concentration
UK customer concentration is healthy. The top 10 UK accounts generate a manageable share of revenue, and it takes a large number of SKUs to reach 80% of UK product revenue. The product mix is diversified.
The phantom accounts. Accounts 16446 and 12346 appear in gross revenue rankings but generate £2.90 and £0.00 in net revenue respectively. Both have 100% cancellation rates. They must be excluded from any valuation model. The corrected ranking — re-ranked by net revenue — shows which accounts actually belong in the top 10.
13.97% of UK revenue is generated by the top 10 UK accounts — compared to 17.06% for the whole business combined. UK segment concentration is lower than the combined figure, meaning the UK segment is more evenly distributed than the combined view suggests. The international segment is what pulls combined concentration upward. No concentration intervention is required at the UK segment level.
The UK segment’s healthy concentration profile is a positive signal for an acquirer — the revenue base is not dangerously dependent on one or two relationships. Losing any single UK account, while unwelcome, is not a segment-level event. This stands in sharp contrast to the international segment where four accounts generate 44.33% of international revenue. For due diligence purposes: UK account concentration does not require pre-close mitigation. International concentration does.
| Metric | Value |
|---|---|
| Top 10 UK accounts — % of total revenue | 13.97% |
| UK accounts needed to reach 80% of revenue | 1,115 |
| Total UK accounts in segment | 3,940 |
| Median revenue per UK account | £626.50 |
| Concentration signal | ✓ Healthy — top 10 UK accounts = 13.97% of revenue |
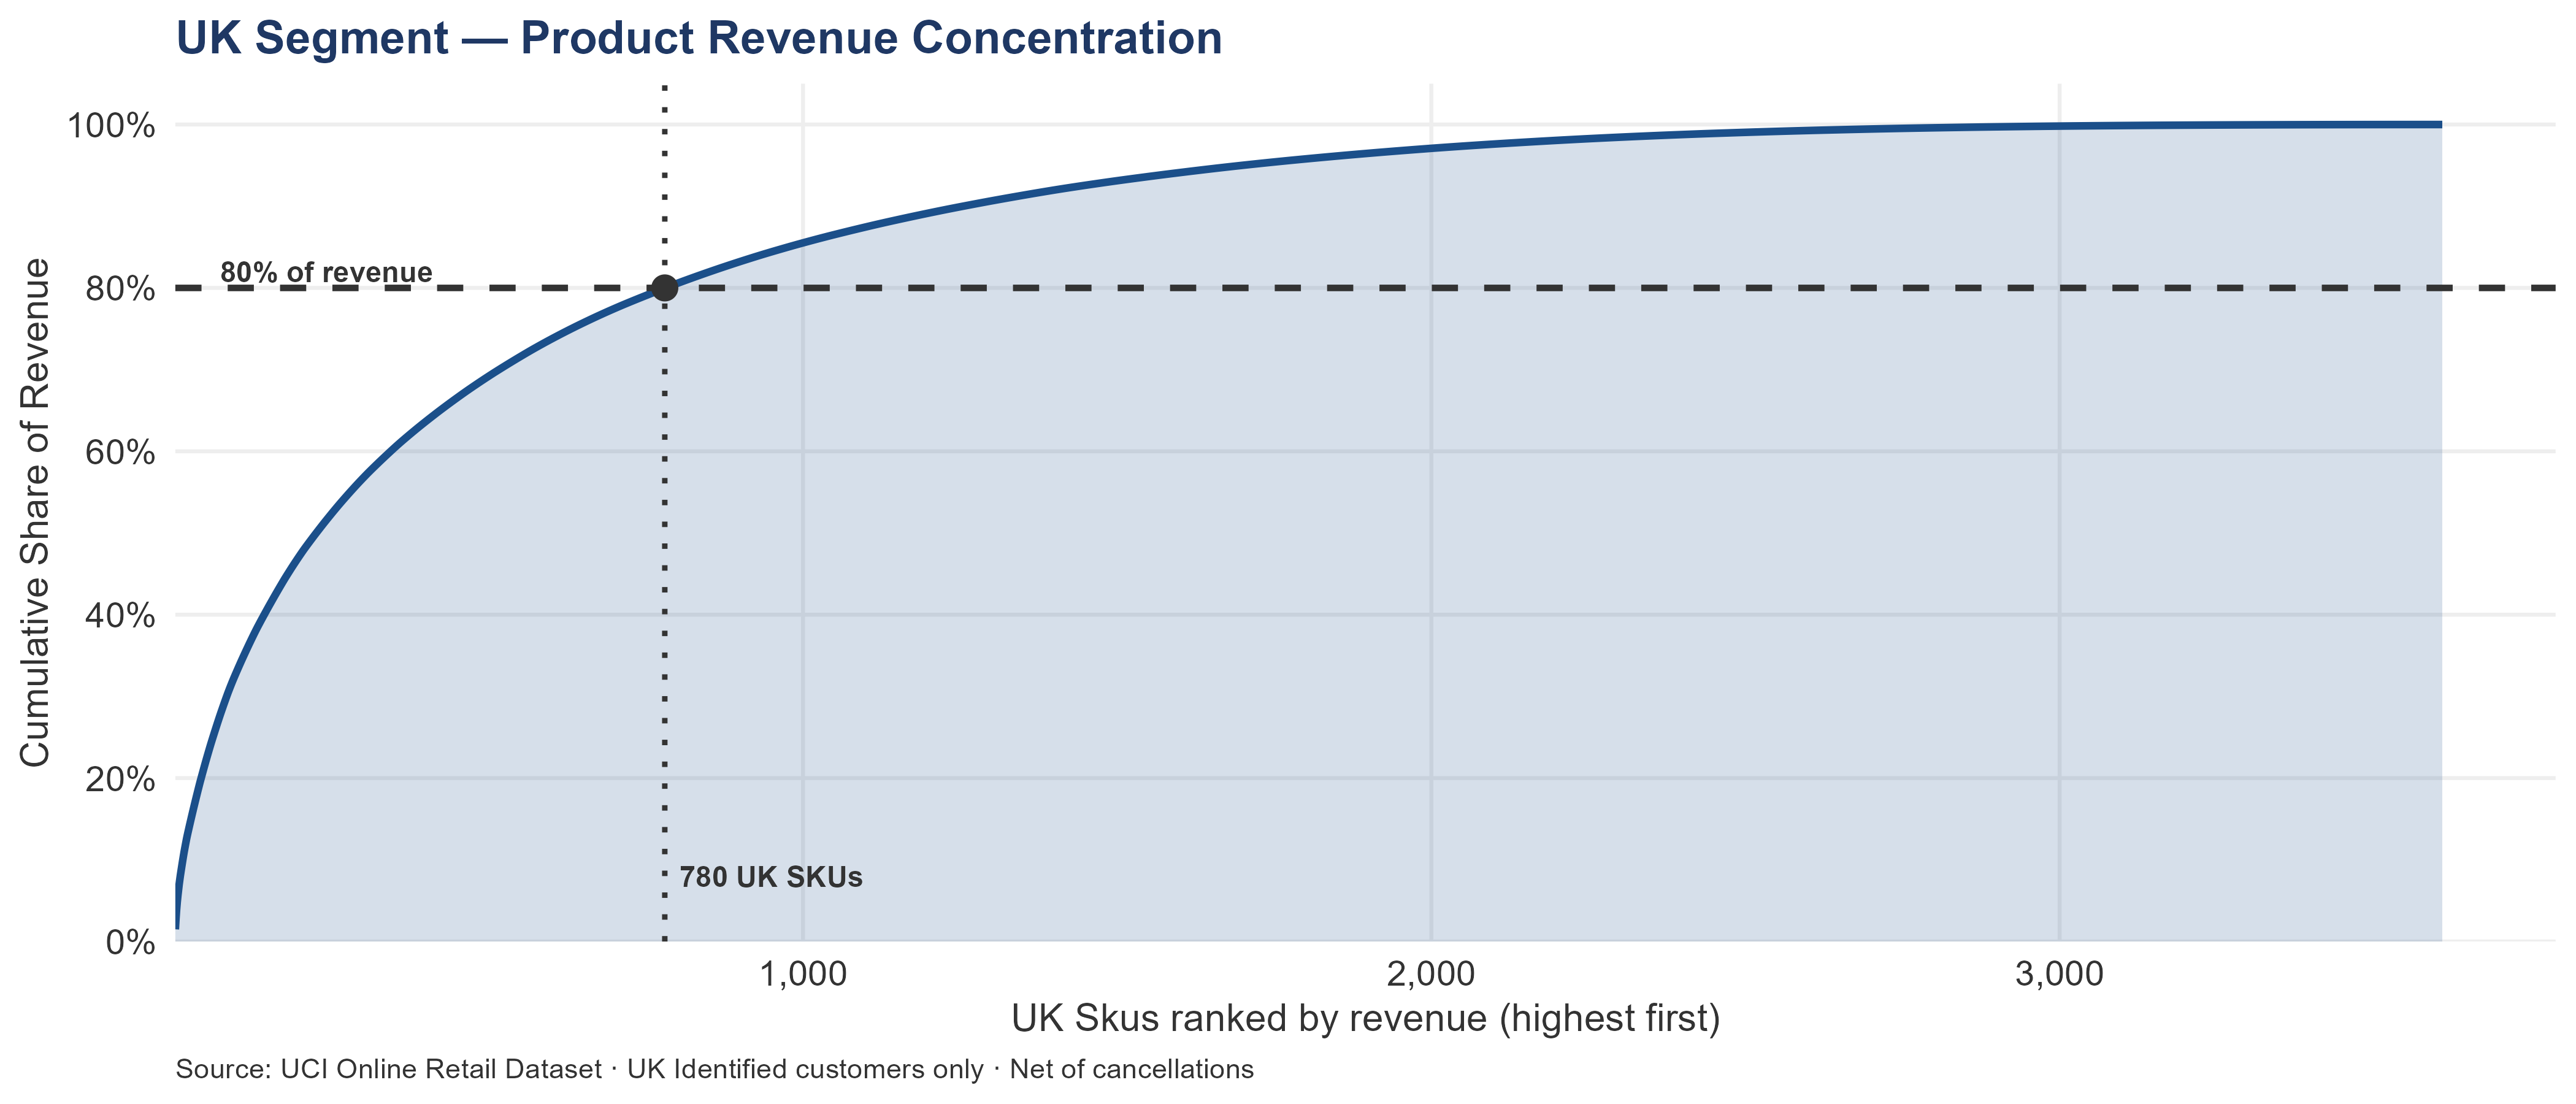
The top 10 UK SKUs generate 8.59% of UK net revenue. It takes 780 SKUs to reach 80% of UK revenue, against 872 SKUs for the combined business. UK product revenue is essentially as distributed as the whole-business view — no UK-specific catalog action required.
Healthy product distribution means the UK catalog does not have a single-product dependency risk. The flip side: 2,829 SKUs collectively generate only 20% of UK revenue — the long tail. Pre-close, the acquirer should request an inventory schedule and apply a conservative markdown to SKUs outside the top 780, particularly those with no orders in the last 90 days.
| Metric | Value |
|---|---|
| Top 10 UK SKUs — % of total revenue | 8.59% |
| UK SKUs needed to reach 80% of revenue | 780 |
| Total UK SKUs in segment | 3,609 |
| Median revenue per UK SKU | £491.25 |
| Concentration signal | ✓ Healthy — top 10 UK SKUs = 8.59% of revenue |
13.1.2 International Concentration
International concentration is in the elevated tier. Only 84 accounts generate 80% of international revenue. The top four accounts alone generate 44.33% of the segment. Account 14646 generates 19.02% by itself — enough that the loss of a single account would be a material event at the segment level.
The international product mix is narrower than the UK mix — fewer SKUs reach the 80% revenue threshold. This simplifies stock planning but increases exposure to supply disruption on any single product.
The top 10 international accounts generate 52.25% of international revenue. It takes 84 accounts to reach 80% of international revenue. Because international customers have structurally higher AOV than UK customers, elevated customer concentration in this segment is a more acute commercial risk — a single lost top-10 international account represents proportionally more revenue than a single lost top-10 UK account.
This is the single most important concentration finding in the entire report for an acquirer. Only 84 accounts generate 80% of international segment revenue. In a segment of 416 accounts, that means a handful of relationships hold a majority of the segment’s value. Losing one top-10 international account is not an account management failure — it is a segment-level revenue event. The pre-close action is unambiguous: the acquirer needs a named owner assigned to each of the top-10 international accounts before close, personal contact with each within week 1 post-close, and a relationship continuity assessment for each before signing. The four accounts generating 44% of international revenue cannot wait.
Named owners assigned to top 10 international accounts within Week 1 (Day 1–7). Top 4 are Priority 3 — already Day 1 post-close action. Remaining 6 within Month 1 (Days 1–30). Owner: buyer’s COO or equivalent organizational owner + buyer’s International commercial lead.
| Metric | Value |
|---|---|
| Top 10 intl accounts — % of total revenue | 52.25% |
| intl accounts needed to reach 80% of revenue | 84 |
| Total intl accounts in segment | 416 |
| Median revenue per intl account | £900.99 |
| Concentration signal | ⚠ Elevated — top 10 intl accounts = 52.25% of revenue |
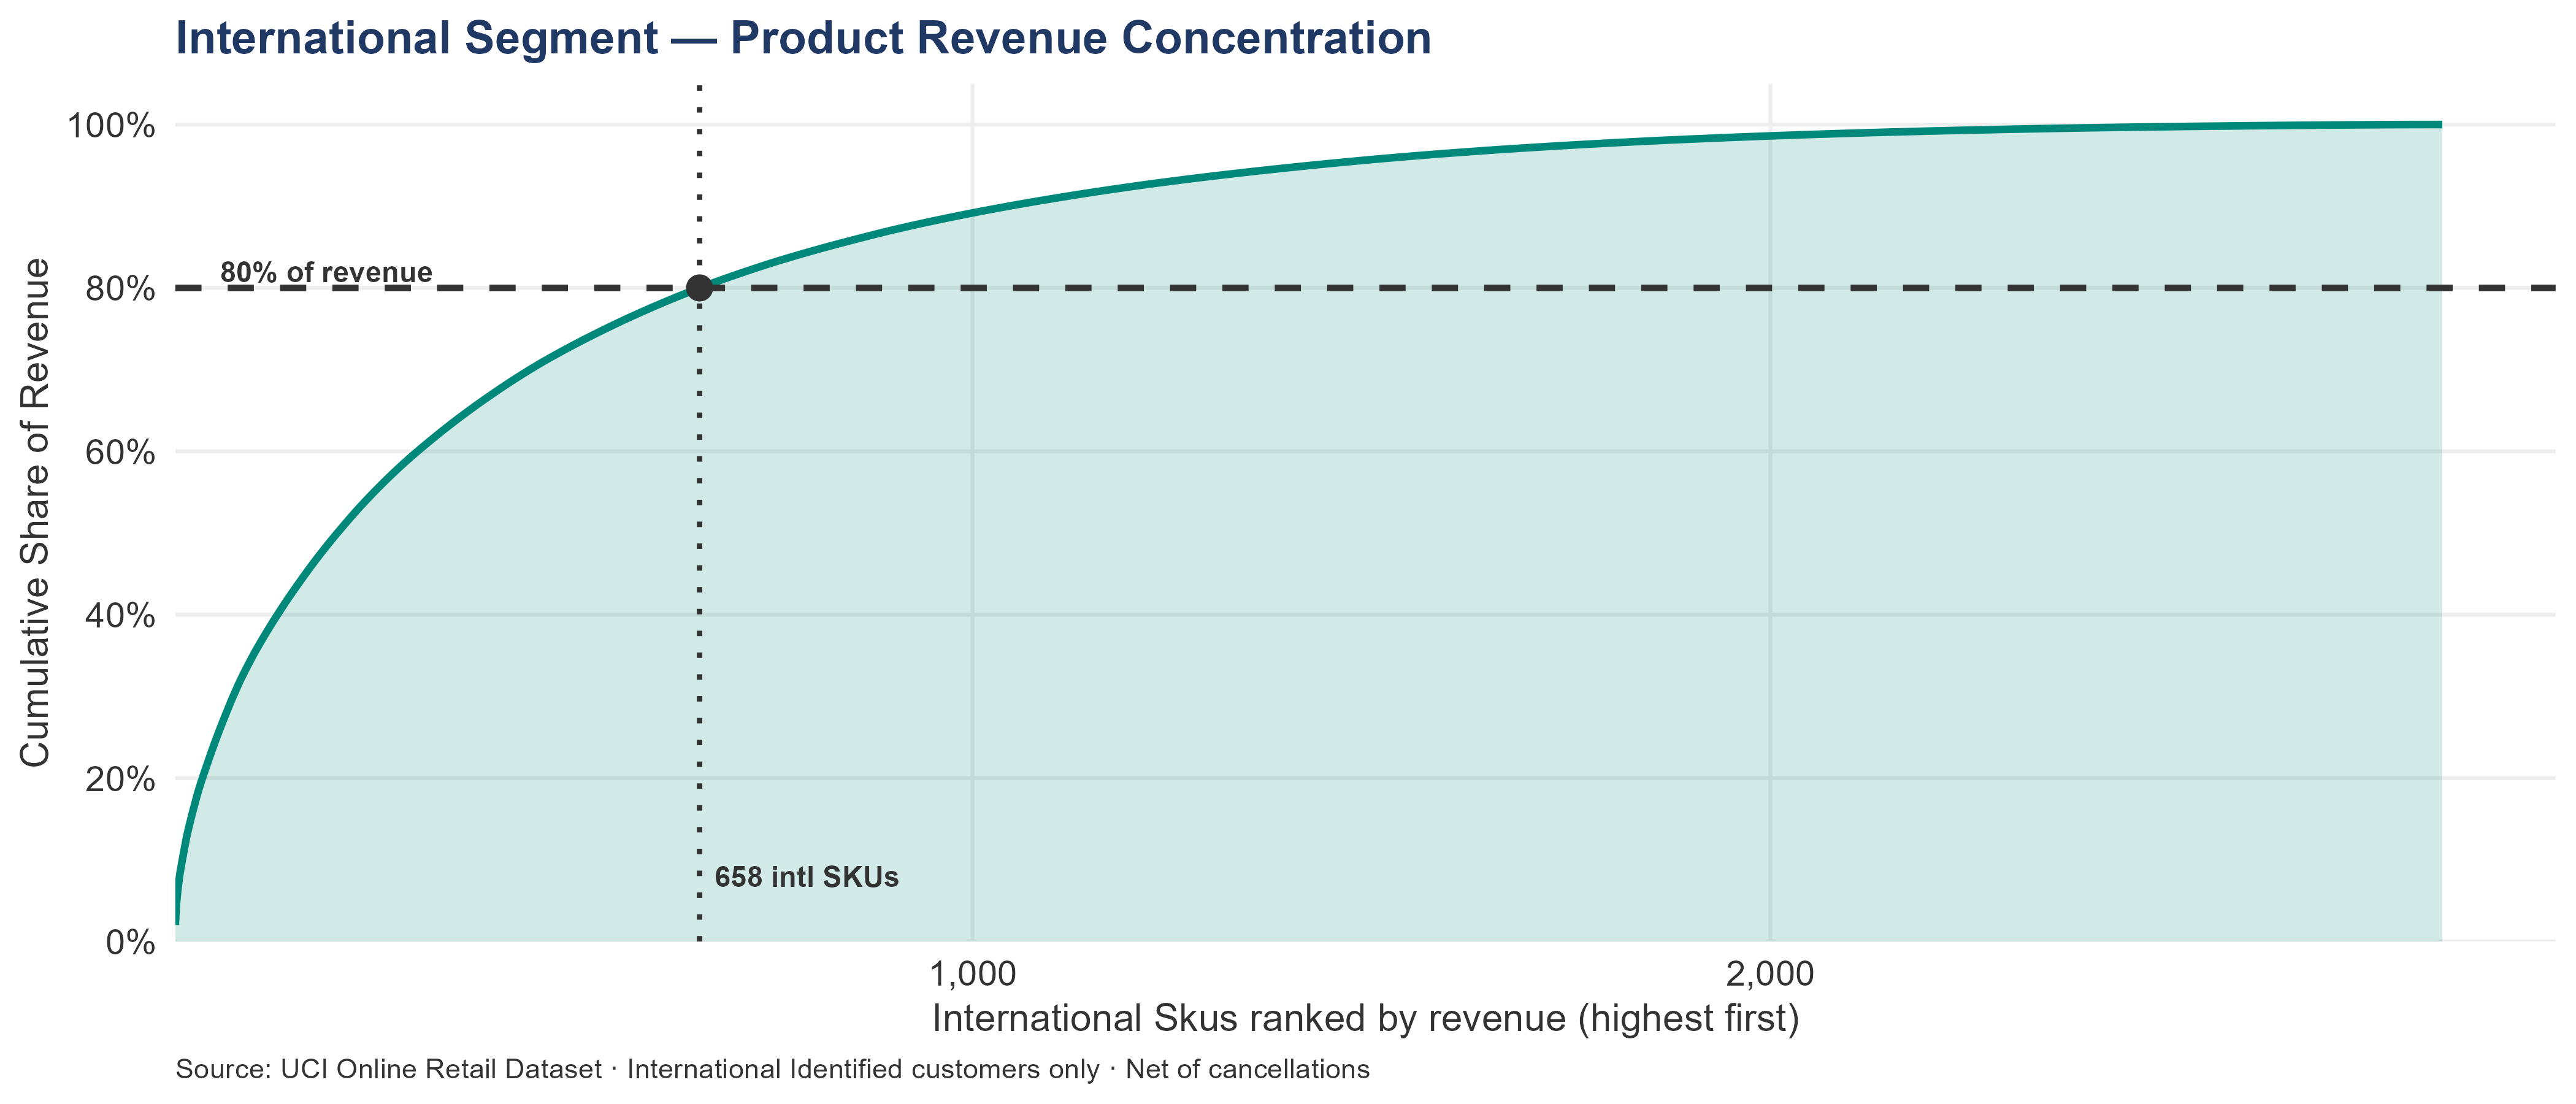
The top 10 international SKUs generate 10.12% of international net revenue. It takes 658 SKUs to reach 80% of international revenue. A more concentrated international SKU curve than the UK curve means international customers are clustering their spend on fewer products — which simplifies stock prioritization for that segment but increases exposure if any of those products experience supply problems heading into Q4.
The international catalog is narrower than the UK catalog in commercial terms. Simplification: international stock planning, supplier negotiations, and pricing governance can focus on 658 SKUs and cover 80% of international revenue. Vulnerability: supply disruption on any of those 658 SKUs hits the international segment harder than an equivalent disruption would hit UK. Pre-close, confirm current inventory levels and supplier lead times for the top-20 international SKUs against the Q4 demand forecast.
| Metric | Value |
|---|---|
| Top 10 intl SKUs — % of total revenue | 10.12% |
| intl SKUs needed to reach 80% of revenue | 658 |
| Total intl SKUs in segment | 2,842 |
| Median revenue per intl SKU | £143.73 |
| Concentration signal | ✓ Healthy — top 10 intl SKUs = 10.12% of revenue |
Concentration analysis is not possible for the anonymous segment — without CustomerID, individual customers cannot be aggregated into accounts. The £1.51M anonymous revenue is structurally unconcentratable until the resolution program assigns IDs.
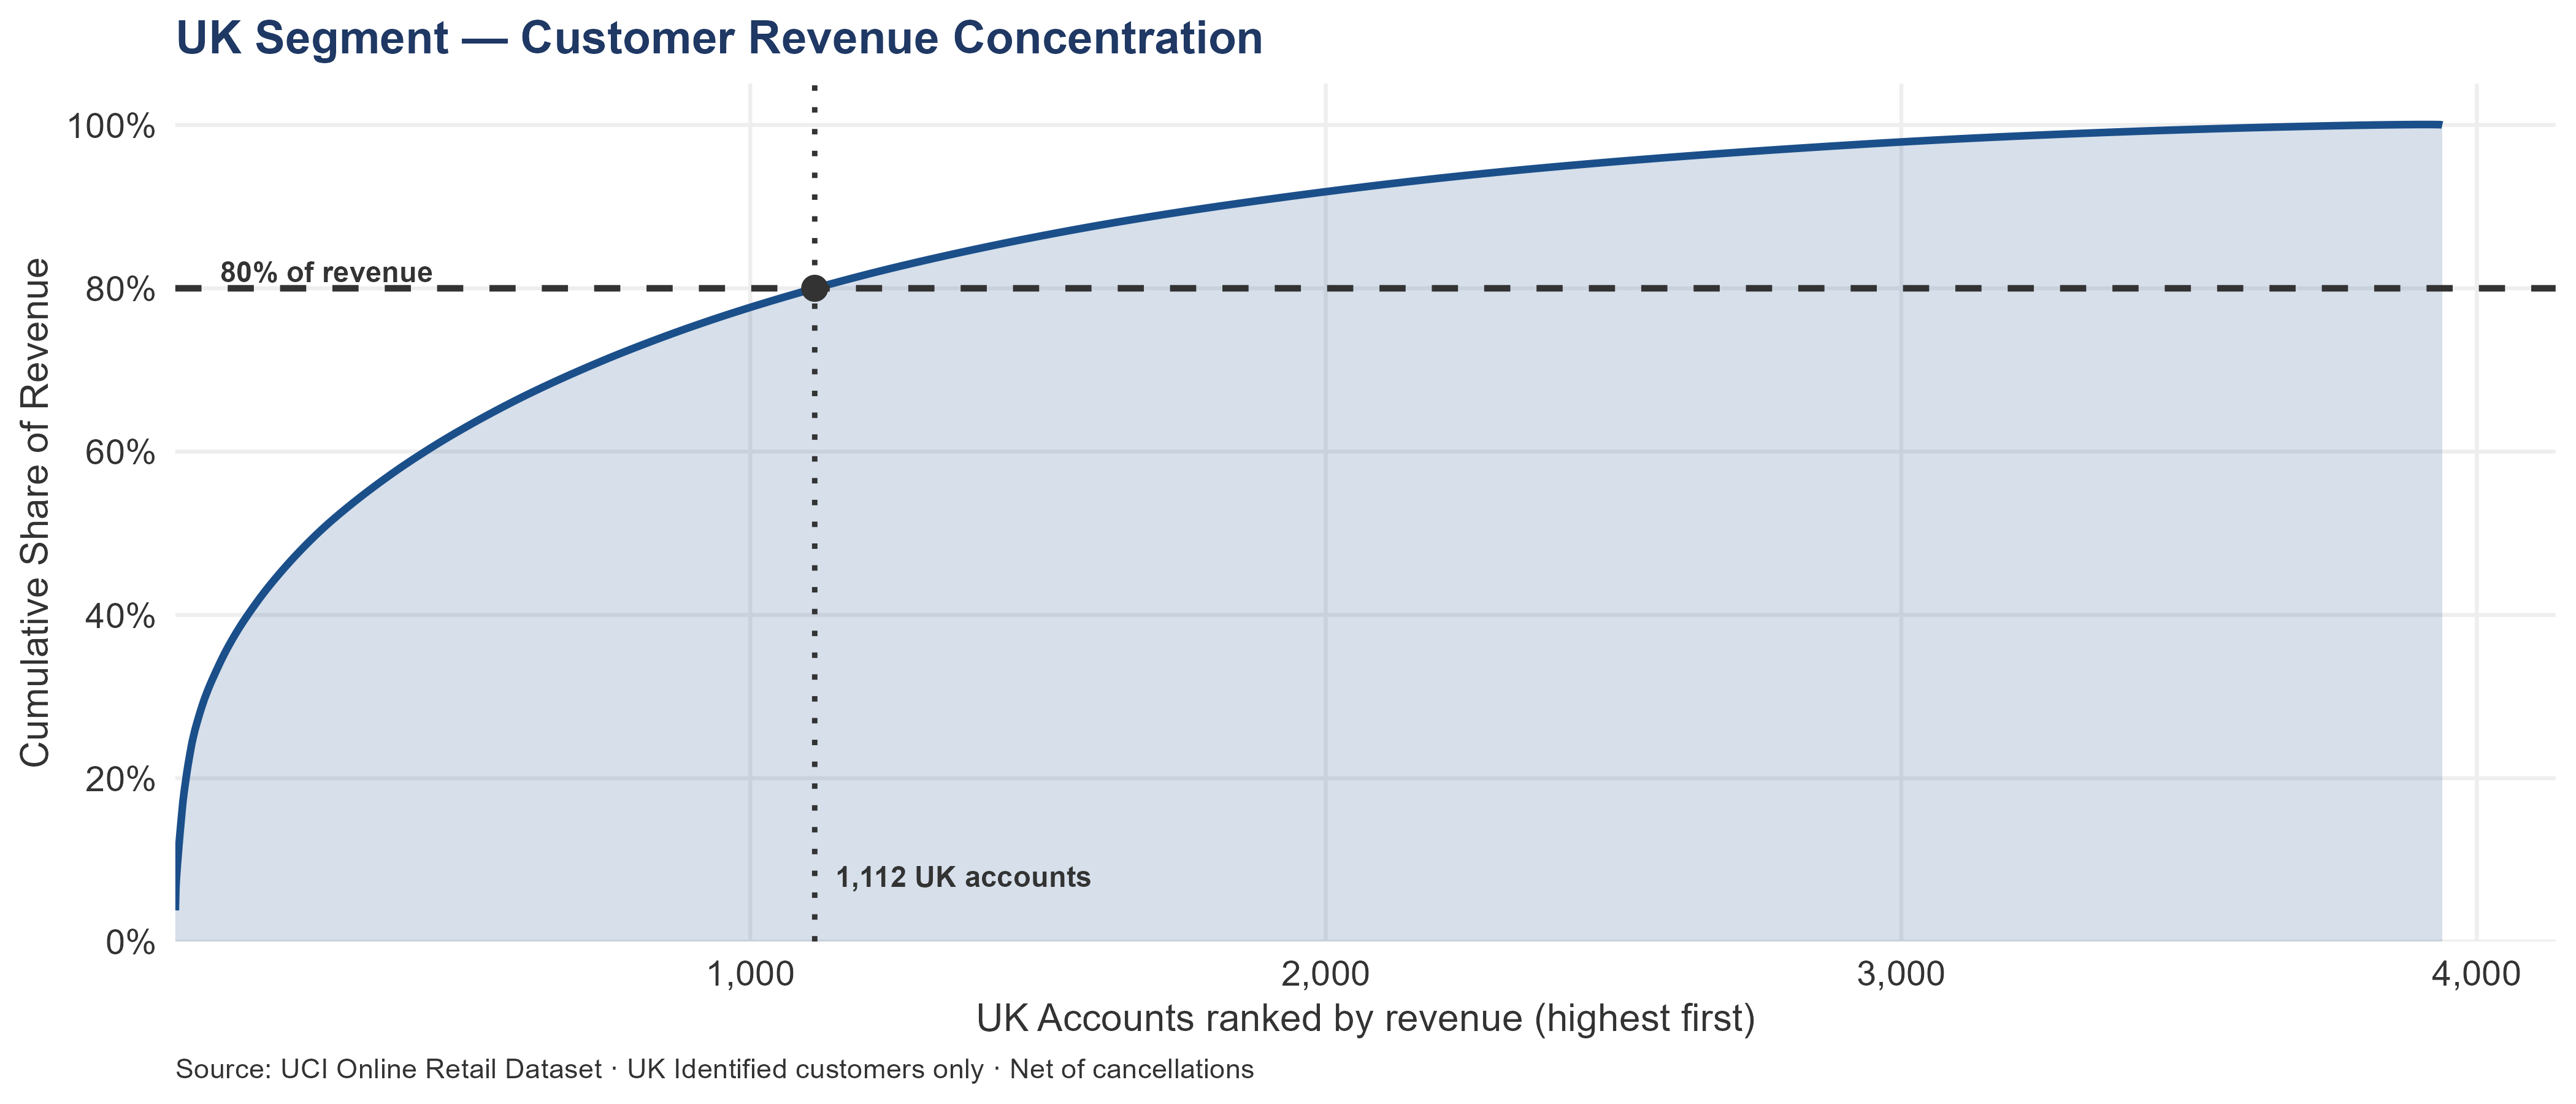
13.2 UK Segment Deep Dive — Revenue Concentration
The chart ranks all UK Identified accounts from highest to lowest by net revenue and plots the cumulative share of total UK revenue captured by the top N accounts. The dashed line marks the 80% threshold; its intersection with the curve shows how many accounts are required to cover 80% of UK revenue.
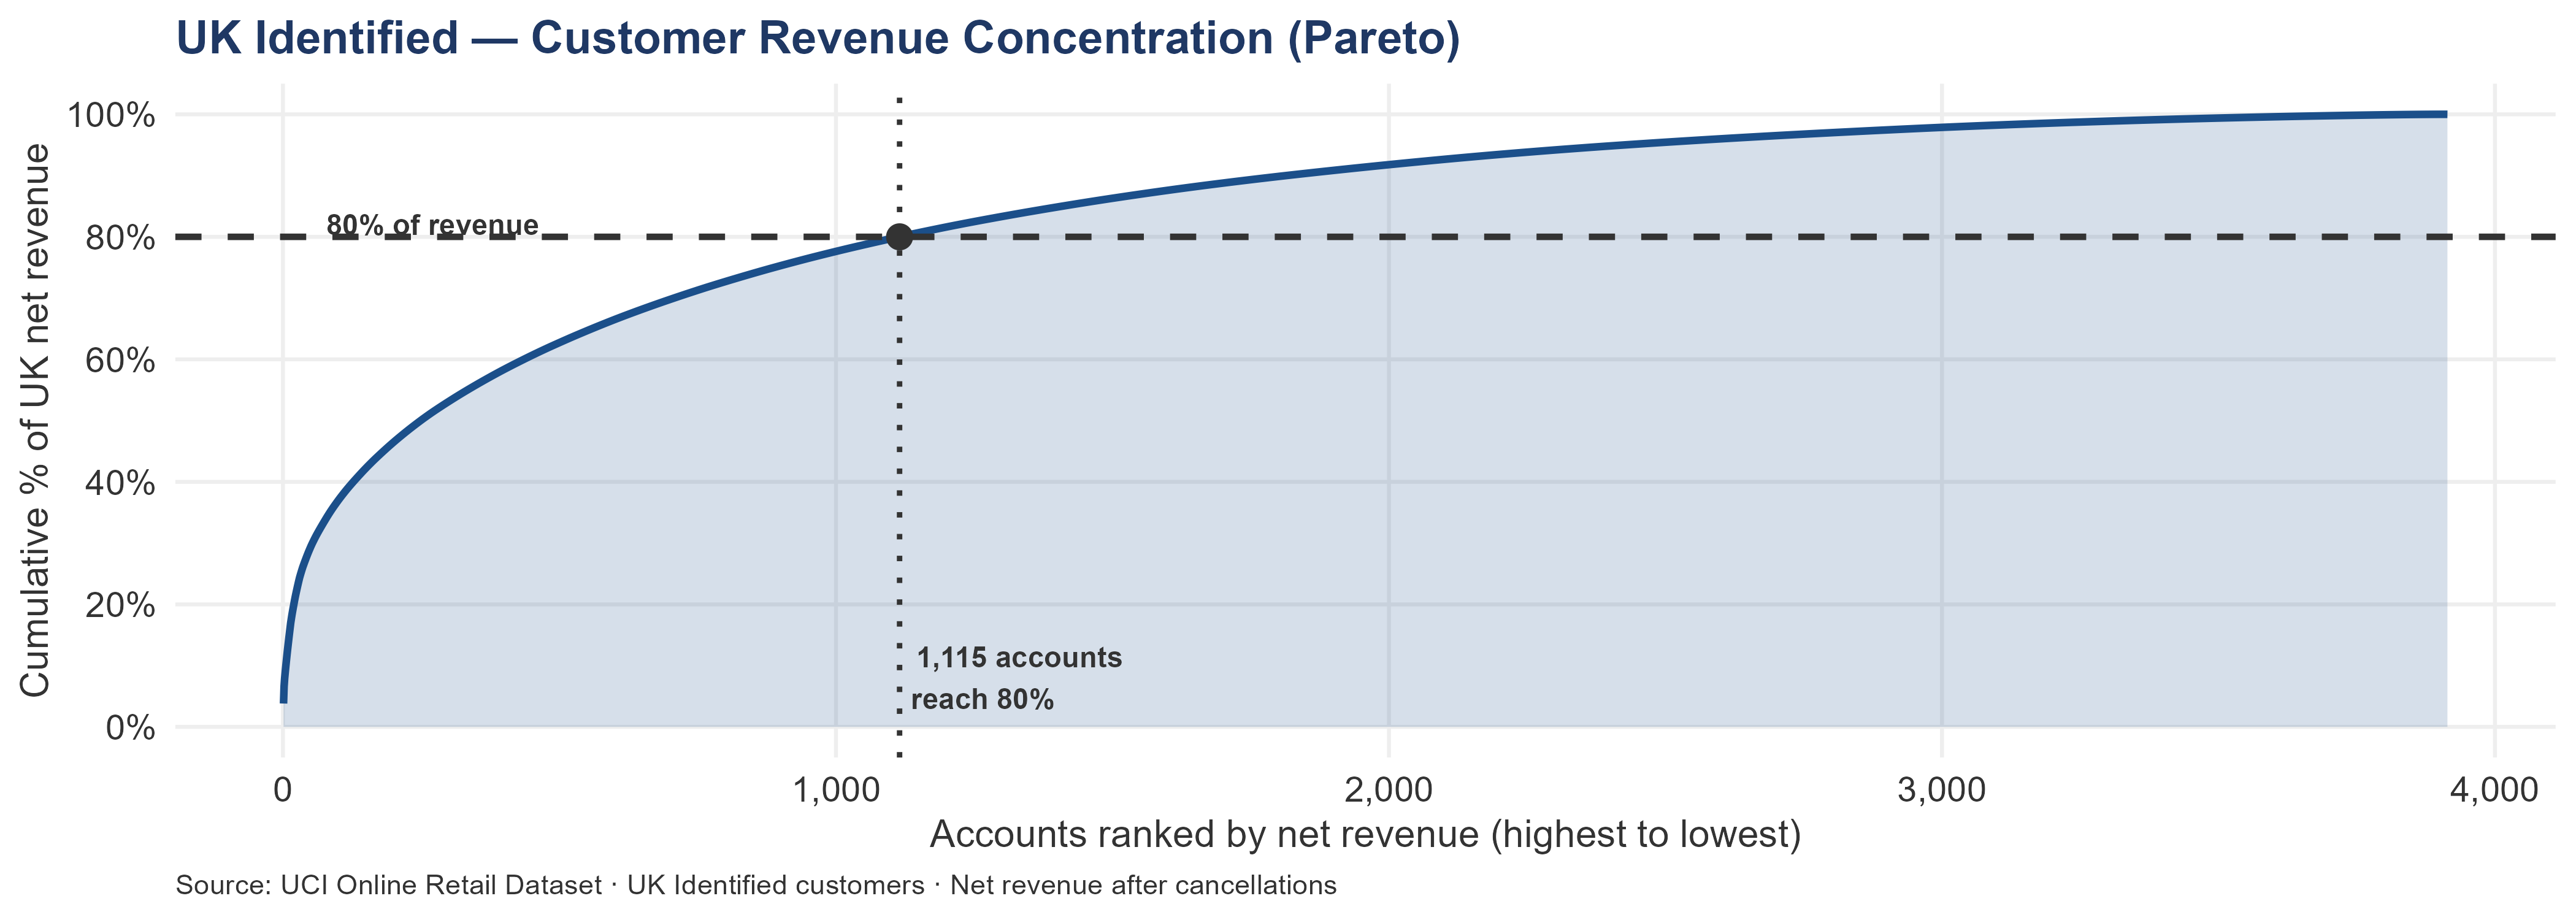
The top 10 UK accounts generate 13.97% of UK Identified net revenue. It takes 1,115 accounts — 28.49% of the base — to reach 80%. The remaining 2,799 accounts together produce the final 20%.
The shape of the curve matters more than the headline percentage. A curve that drops steeply then flattens indicates extreme individual-account weight. A curve that declines more gradually indicates revenue spread across a wider base, where the loss of any single account is proportionally less severe. The UK curve falls into the latter category — concentration is moderate for a wholesale business, and no single account event constitutes a segment-level crisis.
For account team time allocation, the implication is arithmetic: in a portfolio of 100 accounts, roughly the top 28 by revenue will generate 80% of that portfolio’s value. Equal attention across all 100 is misallocated. The correct model is tiered — named managers and quarterly reviews for the top tier, structured touchpoints for the middle tier, systematic outreach at lower frequency for the remainder.
The whole-business top 10 accounts represent approximately 17.06% of total net revenue. The UK top 10 at 13.97% is lower, partly because the UK base is larger in absolute terms — more accounts mechanically reduces the share held by the top 10. For an acquirer, the UK segment is where scale-based programs pay off: improving retention across 3,940 accounts by 1–2 percentage points moves more absolute revenue than winning any individual account.
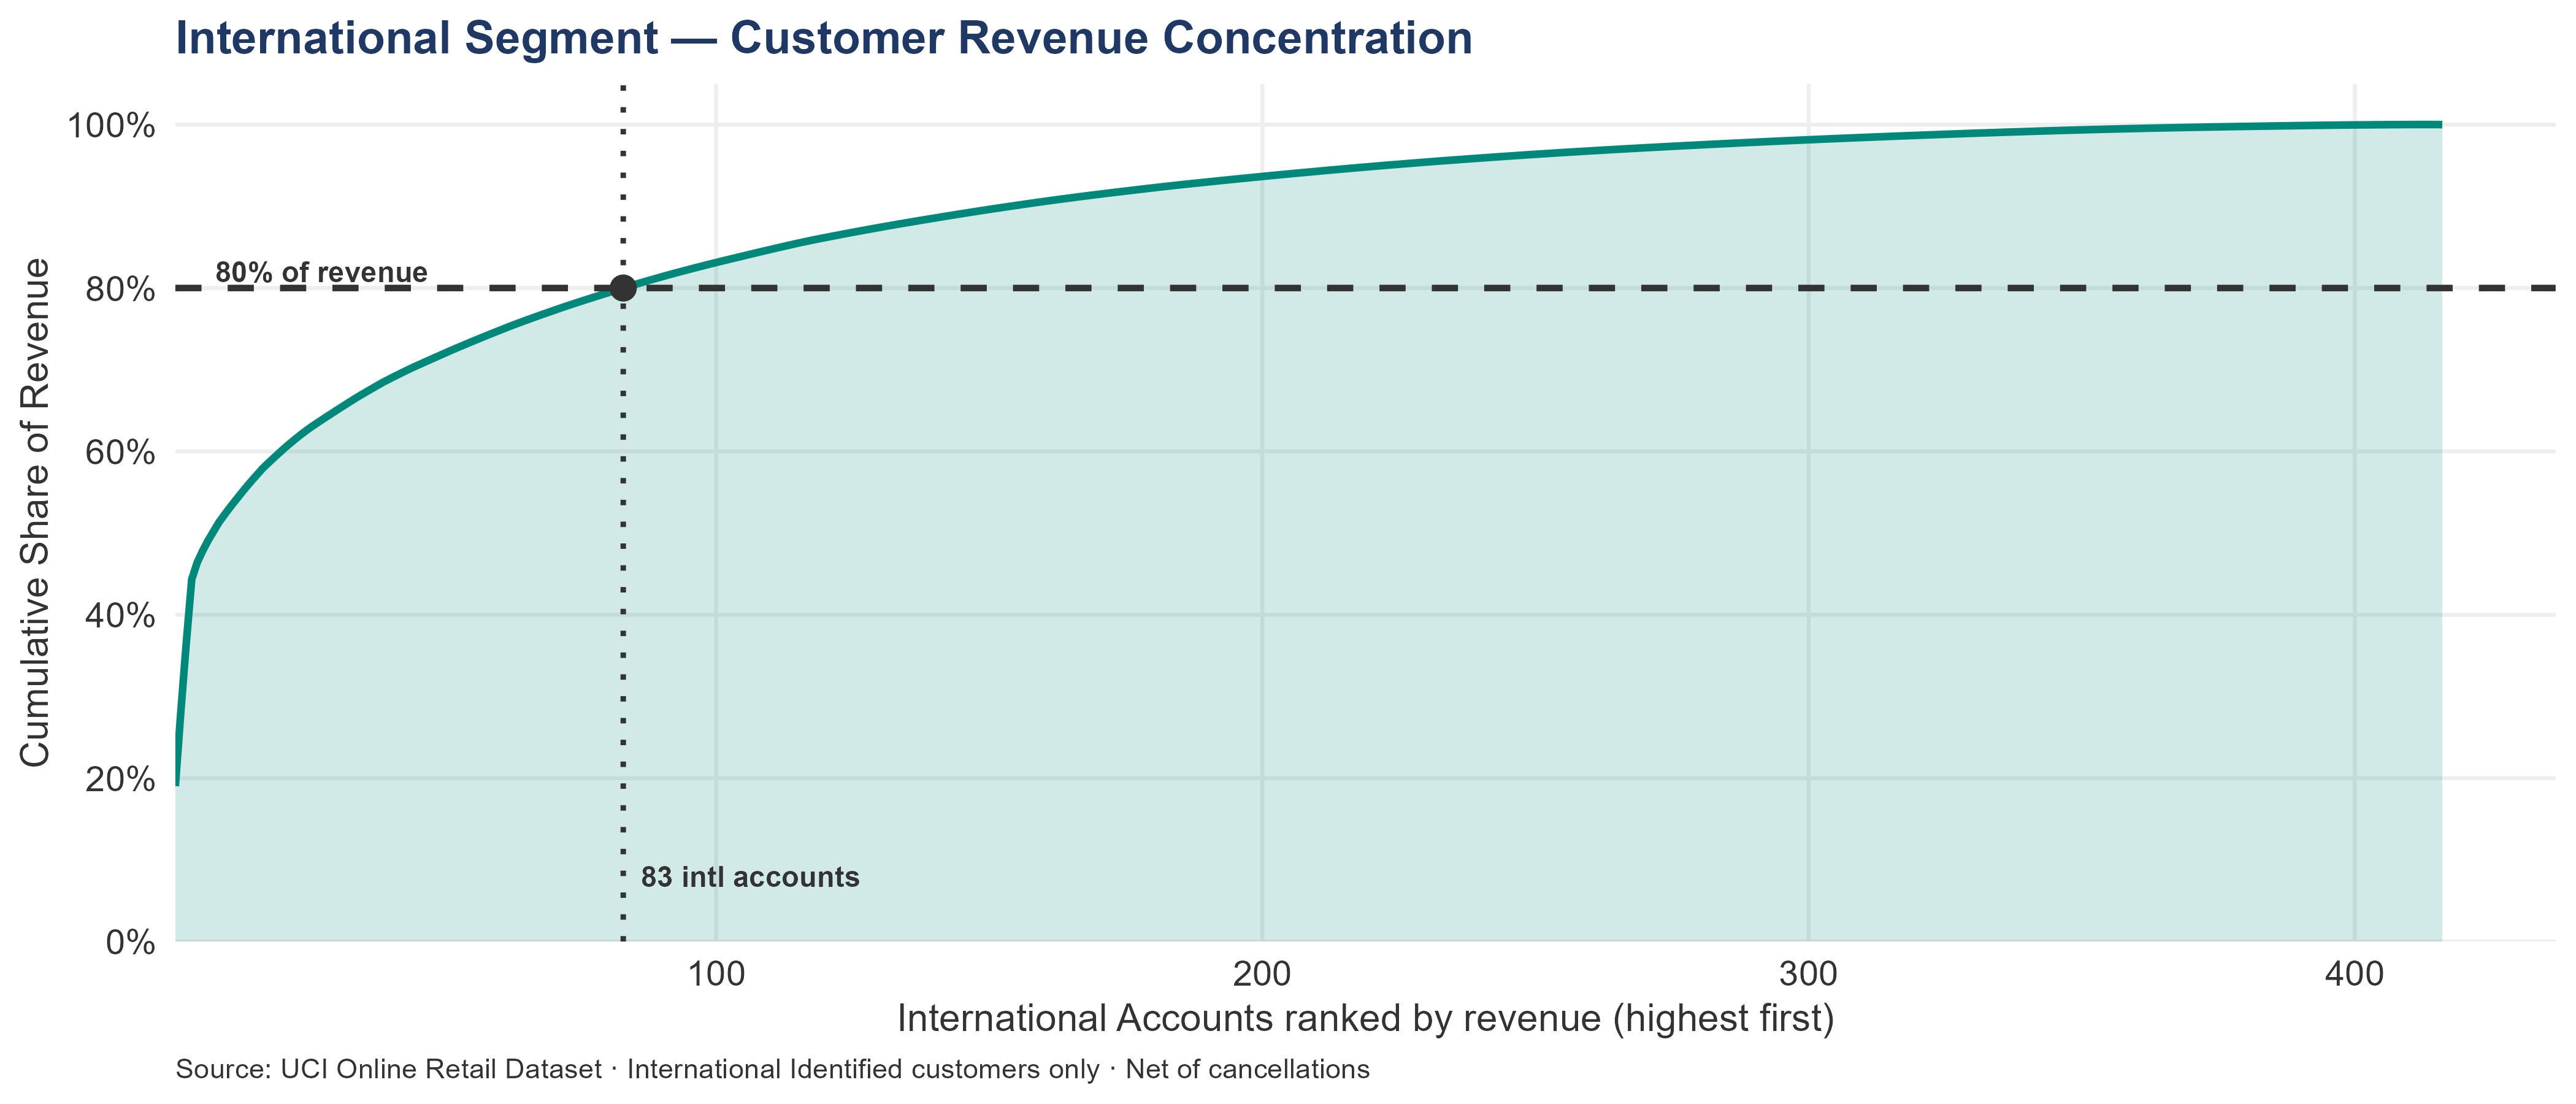
13.3 International Segment Deep Dive — Revenue Concentration
The chart ranks all 414 international accounts from highest to lowest revenue and plots the cumulative share captured by the top N accounts. The dashed line marks 80% of international revenue; its intersection with the curve shows the number of accounts required to reach that threshold.
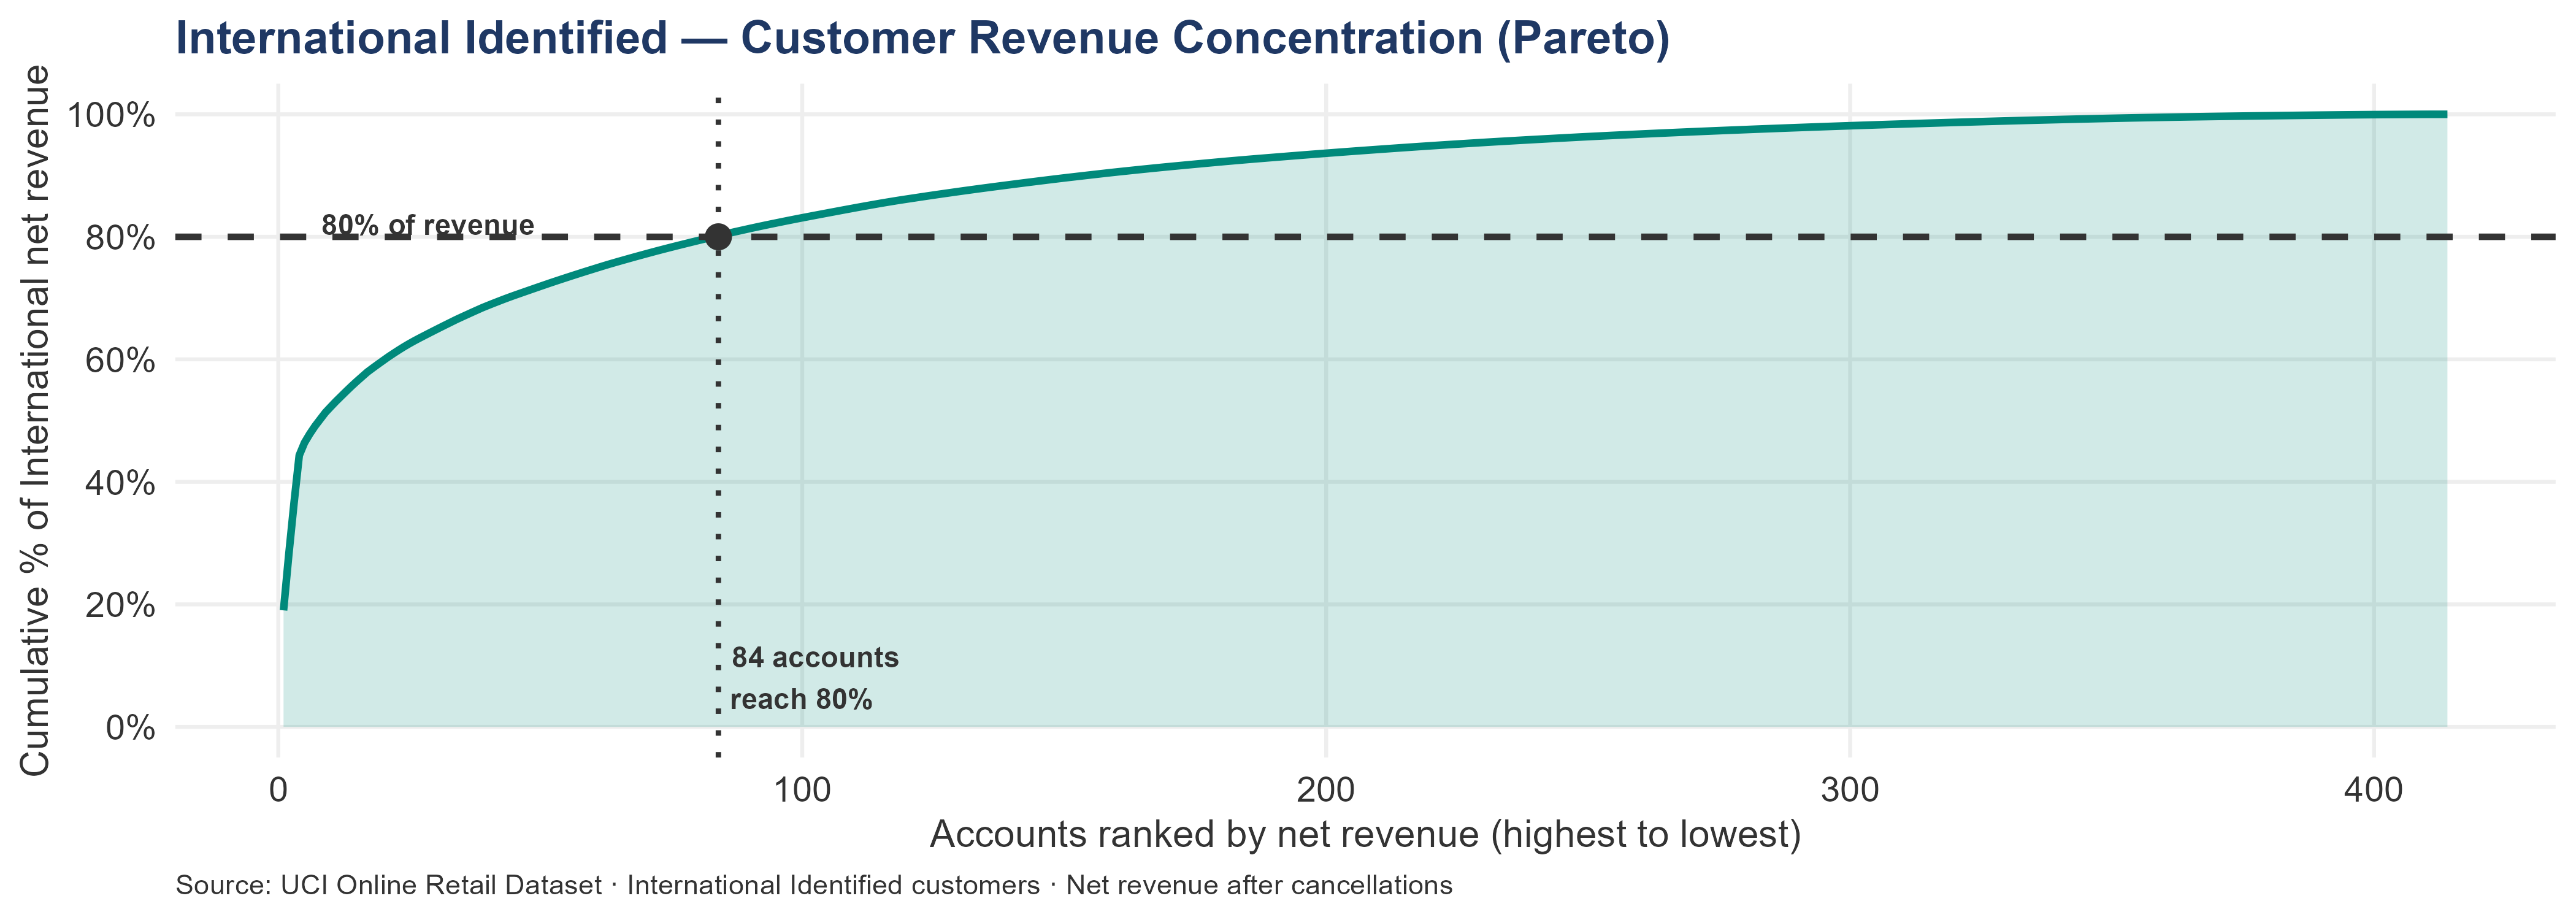
The shape of the international Pareto curve differs starkly from the UK’s. Where the UK curve rises gradually — reflecting revenue distributed across a broad account base — the international curve steps upward sharply. The first handful of accounts capture a disproportionate share before the curve begins to flatten. That steep initial segment is a visual representation of the concentration problem: a small number of relationships hold a majority of the segment’s commercial value.
The structural difference is best understood through a single comparison. In the UK segment, losing the top account means losing approximately 3.71% of UK revenue — painful but operationally manageable. In the international segment, losing account 14646 means losing 19.02% of international revenue. That is not a recoverable position in the short term. There is no combination of new-account acquisition or existing-account growth that replaces a £278.78K relationship within the same trading year.
When concentration is this severe, the management model must match. The UK segment rewards systematic programs applied at scale — CRM triggers, bulk outreach, standardized cadences. The international segment rewards named relationships managed individually — quarterly business reviews, dedicated account owners, proactive stock-confirmation conversations. Both approaches are required. Neither substitutes for the other. A buyer who applies the UK’s volume-based model to the international segment’s top accounts will under-serve the relationships that carry the most value per account.
| Metric | International | UK Identified |
|---|---|---|
| Total identified accounts | 414 | 3,914 |
| Accounts needed to reach 80% of revenue | 84 | 1,115 |
| % of accounts needed for 80% of revenue | 20.29% | 28.49% |
| Top 10 accounts — share of revenue | 52.25% | 13.97% |
| Top 4 accounts — share of revenue | 44.33% | — |
Author: Shawn Phillips | Lailara LLC
← Acquisition Cost Framework & Regional LTV | Cancellation & Pricing Risk →