14 Cancellation & Pricing Risk
14.1 Cancellation Risk
14.1.1 The Whole-Business Picture
The whole-business cancellation rate has a distinctive characteristic: the median and mean are far apart. In a typical month, the business cancels less than 2% of gross revenue. The mean is pulled upward by two outlier months with rates far above the rest. This distinction matters: the business has an episodic cancellation problem concentrated in specific months, not a structural one. The root cause of those outlier months requires investigation against operational records.
Products appearing in both the top-10 revenue list and the top cancelled products list overstate their net contribution — any stock or pricing decision built on their gross figures works from inflated numbers. Cancellation rates above 100% reflect credit notes whose original orders fall outside the dataset window, a timing artifact rather than a data error.
14.1.2 Cancellation Timing — How Long Between Order and Reversal?
The cancellation rate alone lacks context. Matching each credit note to its original invoice by date reveals how quickly reversals occurred — and that narrows the range of possible causes.
A same-day cancellation eliminates post-delivery physical return: goods cannot ship and return on the date the invoice is raised. Pre-shipment cancellations (1–7 days) are likely lower cost than post-shipment returns (8–30 days), which require reverse logistics. Late returns (30+ days) carry the highest embedded cost.
Timing narrows the cost tier but does not give the cause. A same-day cancellation could be a data entry error, a pre-shipment cancellation, a price dispute, or any other operational event. Every flagged account requires individual investigation.
WarningCancellation Timing — All Events Unmatched
9,288 cancellation events · £896.81K total value reversed
Every C-prefix credit note in this dataset is unmatched — no corresponding original invoice was found within the December 2010–December 2011 window. This means the original orders being reversed were placed before the dataset begins, or the invoice numbering convention differs between order entry and credit note systems.
Investigation action: Pull order records from before December 1, 2010 and re-run the timing match. Until then, treat all 9,288 cancellation events as requiring individual account-level review rather than timing-tier triage. Post-close: buyer’s Finance team + IT. Deadline: within four weeks.
Priority 0 accounts — timing observation: Accounts 16446 and 12346 both show same-day cancellations. Account 16446 placed order 581483 and cancellation C581484 on the same date (December 9, 2011). Account 12346 placed order 541431 and cancellation C541433 on the same date (January 18, 2011). The same-day pattern means these were not post-delivery returns. The cause cannot be determined from the transaction record.
14.1.3 Opening Assessment — What the Data Shows
This analysis identified 55 accounts with cancellation rates of 30% or above. These accounts represent £115.38K in gross revenue — 1.1% of total gross revenue in the dataset — of which £58.76K was retained after cancellations. That means £56.62K of gross revenue was reversed across these accounts. This is the upper-bound recoverable cost of the cancellation problem in this account population, before any operational adjustments.
The three populations in this table:
Accounts 16446 and 12346 (Priority 0): Same-day cancellations of extraordinary quantities; their gross revenue should be excluded from any valuation model.
Active accounts with elevated but sub-100% cancellation rates: 10+ orders and 30–49% cancel rates — a structural cancellation pattern that warrants pre-close investigation against operational records.
Single-order or low-activity accounts at high cancellation rates: Likely a mix of data artifacts and genuine issues. Size by revenue magnitude rather than cancellation rate percentage alone.
14.1.4 Whole-Business — All Accounts with ≥30% Cancellation Rate
The table below lists every account in the dataset with a cancellation rate at or above 30%. Most of these accounts are small — single-order, low-revenue accounts where a 100% cancellation rate means one order was placed and fully reversed. The material exposure is concentrated in a small number of accounts. Account 15749 alone invoiced £44.53K gross and retained only £21.54K after cancellations — making it the single largest contributor to the high-cancellation revenue gap at the whole-business level. Accounts 14607 and 15482 are the next two largest by gross revenue. Together, these three accounts define the shape of the cancellation problem: a long tail of small accounts that are individually immaterial, and a short head of accounts where the revenue reversal is large enough to affect account-level projections in a valuation model.
Two patterns matter in this table: accounts with high order counts and elevated cancellation rates — suggesting a structural issue rather than a one-off event — and accounts with large absolute gross revenue where even a moderate rate produces a material gap between invoiced and retained revenue.
| Customer ID | Segment | Gross Revenue | Cancellations | Net Revenue | Cancel Rate | Orders 2010 | Orders 2011 | Note |
|---|---|---|---|---|---|---|---|---|
| 17548 | UK | £103 | £245 | £-141 | 236.96% | 0 | 1 | 100% cancellation |
| 16546 | UK | £787 | £883 | £-96 | 112.19% | 1 | 1 | 100% cancellation |
| 12454 | International | £3.53K | £3.53K | £0 | 100.00% | 0 | 1 | 100% cancellation |
| 12558 | International | £270 | £270 | £0 | 100.00% | 0 | 1 | 100% cancellation |
| 12607 | International | £1.58K | £1.58K | £0 | 100.00% | 0 | 1 | 100% cancellation |
| 13364 | UK | £135 | £135 | £0 | 100.00% | 0 | 1 | 100% cancellation |
| 13672 | UK | £186 | £186 | £0 | 100.00% | 0 | 2 | 100% cancellation |
| 13762 | UK | £307 | £307 | £0 | 100.00% | 0 | 1 | 100% cancellation |
| 14557 | UK | £788 | £788 | £0 | 100.00% | 0 | 1 | 100% cancellation |
| 14792 | UK | £6 | £6 | £0 | 100.00% | 0 | 1 | 100% cancellation |
| 16878 | UK | £13 | £13 | £0 | 100.00% | 0 | 1 | 100% cancellation |
| 18268 | UK | £26 | £26 | £0 | 100.00% | 0 | 1 | 100% cancellation |
| 18274 | UK | £176 | £176 | £0 | 100.00% | 0 | 1 | 100% cancellation |
| 18072 | UK | £247 | £235 | £12 | 95.05% | 0 | 1 | High cancellation (≥50%) |
| 17900 | UK | £112 | £97 | £15 | 86.63% | 0 | 2 | High cancellation (≥50%) |
| 12504 | International | £428 | £368 | £60 | 85.98% | 0 | 2 | High cancellation (≥50%) |
| 13217 | UK | £534 | £400 | £134 | 74.98% | 0 | 3 | High cancellation (≥50%) |
| 15221 | UK | £403 | £289 | £114 | 71.70% | 1 | 0 | High cancellation (≥50%) |
| 15973 | UK | £308 | £208 | £100 | 67.59% | 1 | 0 | High cancellation (≥50%) |
| 16716 | UK | £901 | £581 | £320 | 64.51% | 0 | 2 | High cancellation (≥50%) |
| 12908 | UK | £750 | £390 | £360 | 52.00% | 0 | 2 | High cancellation (≥50%) |
| 15749 | UK | £44.53K | £23.00K | £21.54K | 51.64% | 0 | 3 | High cancellation (≥50%) |
| 13587 | UK | £712 | £365 | £347 | 51.29% | 0 | 1 | High cancellation (≥50%) |
| 14205 | UK | £467 | £238 | £228 | 51.04% | 0 | 2 | High cancellation (≥50%) |
| 17867 | UK | £1.16K | £574 | £584 | 49.60% | 0 | 6 | Elevated cancellation (30–49%) |
| 14304 | UK | £383 | £186 | £197 | 48.60% | 0 | 1 | Elevated cancellation (30–49%) |
| 16163 | UK | £857 | £415 | £442 | 48.45% | 1 | 1 | Elevated cancellation (30–49%) |
| 16801 | UK | £1.59K | £752 | £842 | 47.16% | 0 | 4 | Elevated cancellation (30–49%) |
| 13984 | UK | £921 | £432 | £488 | 46.98% | 1 | 4 | Elevated cancellation (30–49%) |
| 14410 | UK | £1.10K | £512 | £587 | 46.56% | 0 | 9 | Elevated cancellation (30–49%) |
| 14109 | UK | £144 | £64 | £80 | 44.38% | 0 | 1 | Elevated cancellation (30–49%) |
| 17190 | UK | £445 | £195 | £250 | 43.85% | 0 | 2 | Elevated cancellation (30–49%) |
| 14586 | UK | £237 | £103 | £134 | 43.48% | 0 | 1 | Elevated cancellation (30–49%) |
| 14149 | UK | £447 | £187 | £259 | 41.91% | 0 | 1 | Elevated cancellation (30–49%) |
| 12755 | International | £3.81K | £1.59K | £2.22K | 41.74% | 1 | 1 | Elevated cancellation (30–49%) |
| 15482 | UK | £10.84K | £4.49K | £6.35K | 41.39% | 2 | 9 | Elevated cancellation (30–49%) |
| 15073 | UK | £1.04K | £431 | £612 | 41.30% | 0 | 3 | Elevated cancellation (30–49%) |
| 17526 | UK | £1.20K | £489 | £707 | 40.91% | 2 | 2 | Elevated cancellation (30–49%) |
| 13680 | UK | £3.72K | £1.52K | £2.20K | 40.87% | 0 | 4 | Elevated cancellation (30–49%) |
| 15223 | UK | £756 | £301 | £455 | 39.81% | 0 | 2 | Elevated cancellation (30–49%) |
| 14760 | UK | £89 | £35 | £54 | 39.69% | 0 | 1 | Elevated cancellation (30–49%) |
| 18024 | UK | £390 | £153 | £237 | 39.25% | 0 | 2 | Elevated cancellation (30–49%) |
| 15197 | UK | £1.08K | £423 | £656 | 39.20% | 1 | 2 | Elevated cancellation (30–49%) |
| 16321 | International | £374 | £143 | £231 | 38.26% | 0 | 5 | Elevated cancellation (30–49%) |
| 16424 | UK | £134 | £51 | £83 | 38.19% | 0 | 1 | Elevated cancellation (30–49%) |
| 16859 | UK | £748 | £275 | £473 | 36.73% | 0 | 2 | Elevated cancellation (30–49%) |
| 16660 | UK | £1.27K | £457 | £810 | 36.07% | 0 | 4 | Elevated cancellation (30–49%) |
| 14607 | UK | £15.02K | £5.23K | £9.79K | 34.81% | 0 | 12 | Elevated cancellation (30–49%) |
| 13085 | UK | £416 | £144 | £272 | 34.54% | 0 | 2 | Elevated cancellation (30–49%) |
| 15681 | UK | £1.43K | £480 | £946 | 33.64% | 0 | 5 | Elevated cancellation (30–49%) |
| 16581 | UK | £106 | £35 | £70 | 33.45% | 0 | 1 | Elevated cancellation (30–49%) |
| 15365 | UK | £2.31K | £765 | £1.55K | 33.06% | 0 | 7 | Elevated cancellation (30–49%) |
| 14665 | UK | £1.84K | £577 | £1.26K | 31.45% | 0 | 5 | Elevated cancellation (30–49%) |
| 13791 | UK | £1.52K | £468 | £1.05K | 30.89% | 0 | 2 | Elevated cancellation (30–49%) |
| 16938 | UK | £2.71K | £833 | £1.88K | 30.73% | 0 | 4 | Elevated cancellation (30–49%) |
The international accounts in this table — 12454, 12558, 12607, 12504, 12755, and 16321 — are discussed separately in the international cancellation section below. Their cancellation patterns may reflect cross-border fulfillment issues rather than the process or account-quality problems that explain most UK cancellations, and the remediation path differs accordingly.
14.2 Segment-Level Cancellation Profile Distribution
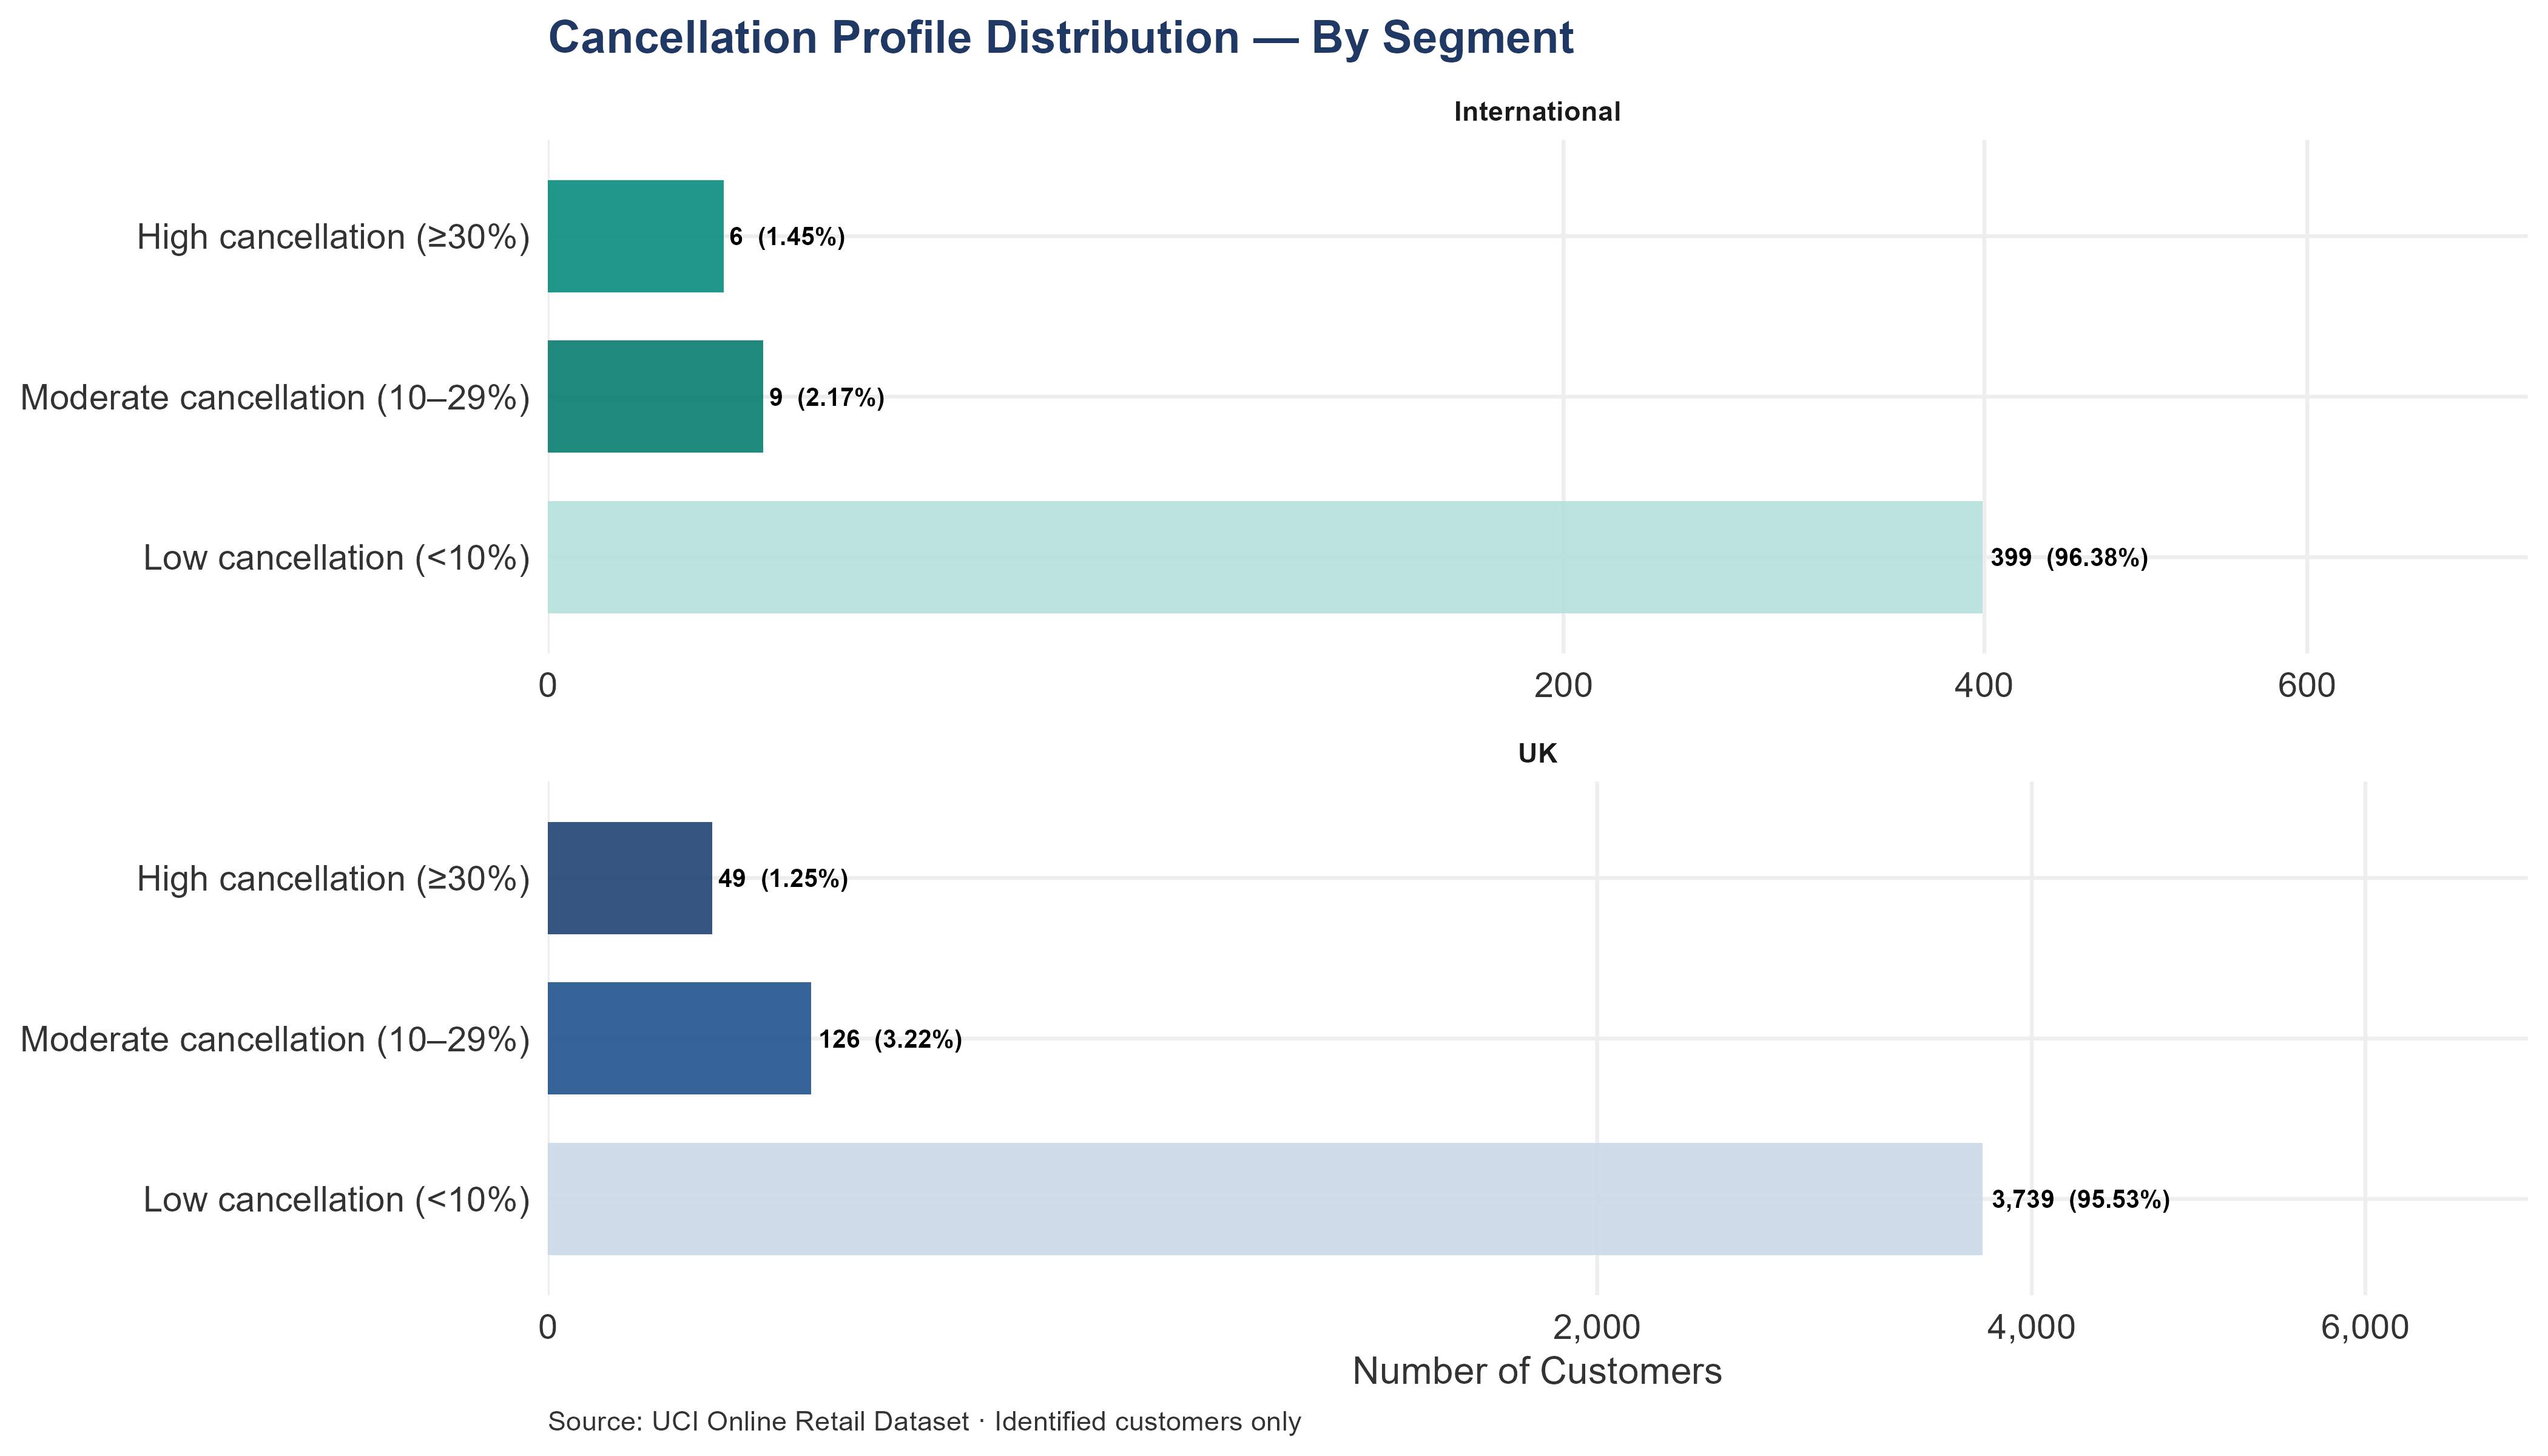
Cancellation profiles for UK Identified and International Identified customers are broken out separately, each on its own scale.
Whether cancellations concentrate in one segment or both determines the remediation path. International cancellations cannot be diagnosed from transaction data alone — root cause requires direct contact with each account. And because international AOV exceeds UK AOV, each cancelled international order reverses a larger absolute revenue amount.
The pre-close DD investigation should treat these as separate workstreams: international accounts require direct contact to surface root cause; UK accounts can be sampled against operational records to confirm whether the pattern is process-driven or account-quality-driven.
Anonymous orders generated £1.51M in gross revenue with £0 in credit notes — a cancellation rate of approximately 0.00%, with £1.51M retained. The zero rate is not a positive signal; it reflects the segment’s structural untraceability. Anonymous cancellations have no audit trail.
14.2.1 UK Cancellations
The UK cancellation rate of 2.78% sits within the standard 2–5% wholesale benchmark. The headline rate is not the concern — the composition is. A small number of accounts with very high cancellation rates drive a disproportionate share of the total. Identifying whether those high-cancellation accounts reflect process problems (order entry errors, stock issues) or account-quality problems (customers who habitually order and cancel) determines whether the response is a process fix or an account review.
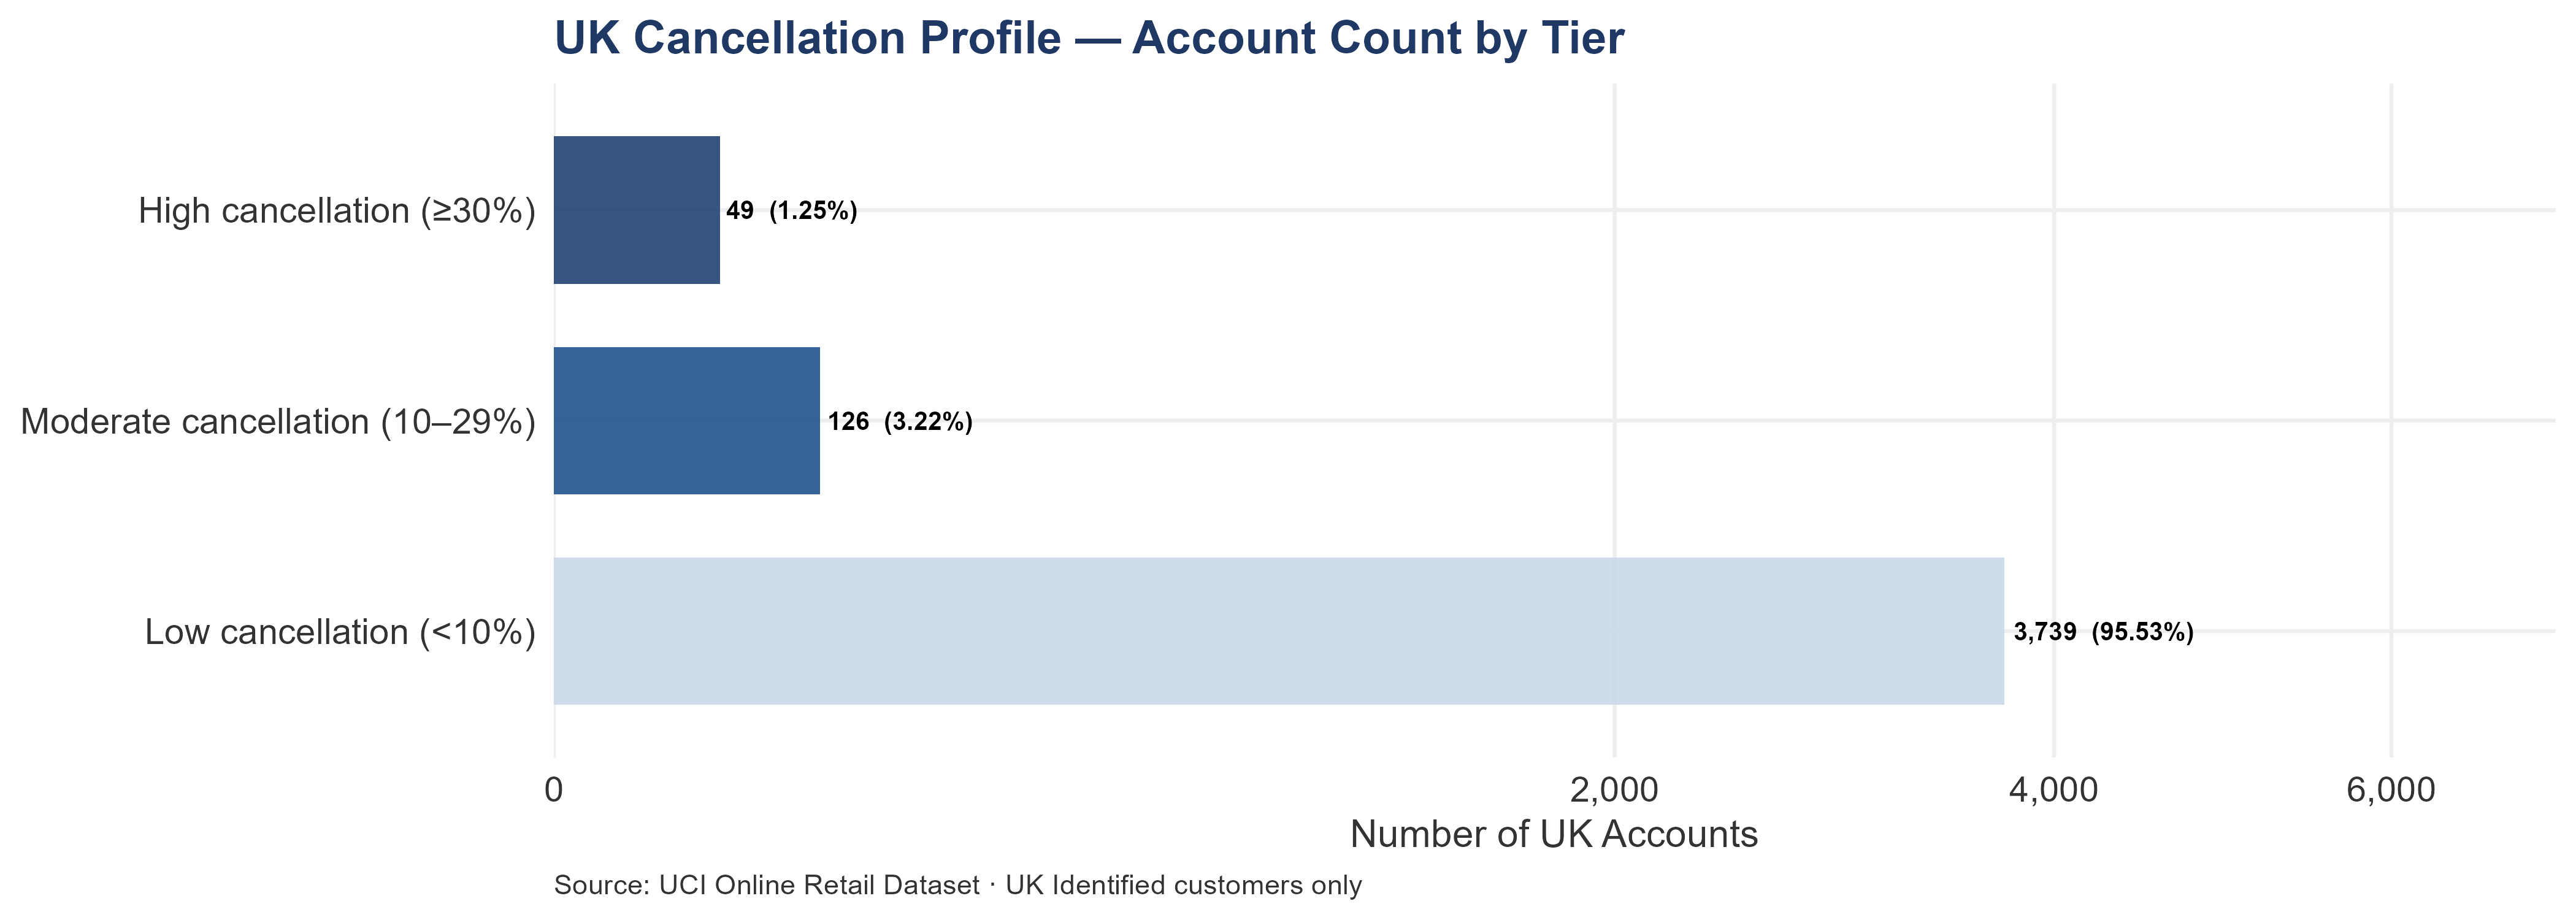
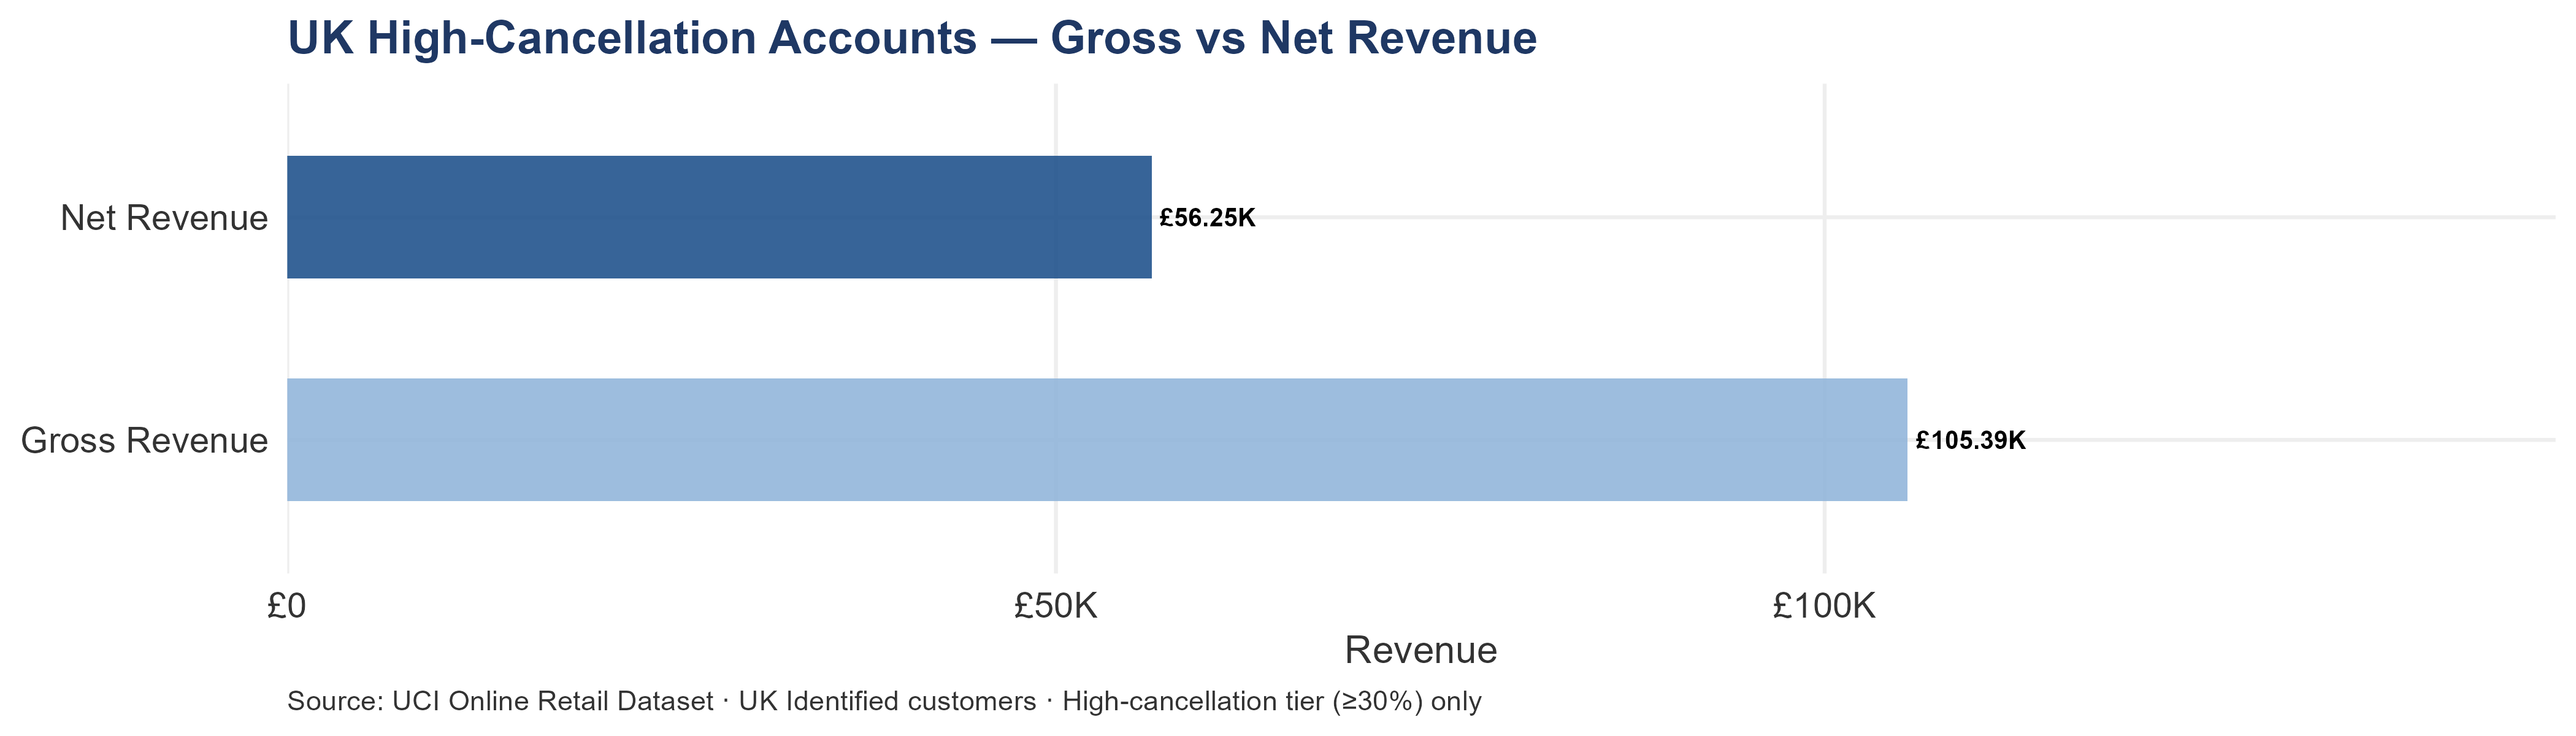
Across the segment, 49 UK accounts — 1.25% of the UK base — fall into the high-cancellation tier (30% or more of gross revenue cancelled). In absolute accounts this is a small minority. In revenue terms it is not: those 49 accounts invoiced £105.39K gross and retained only £56.25K net — a gap of £49.14K in revenue that was processed, reversed, and never collected.
This £49.14K gap is not a bad debt — it is an operational pattern. A valuation model that uses gross UK revenue without a cancellation adjustment overstates the business’s true commercial output by this amount.
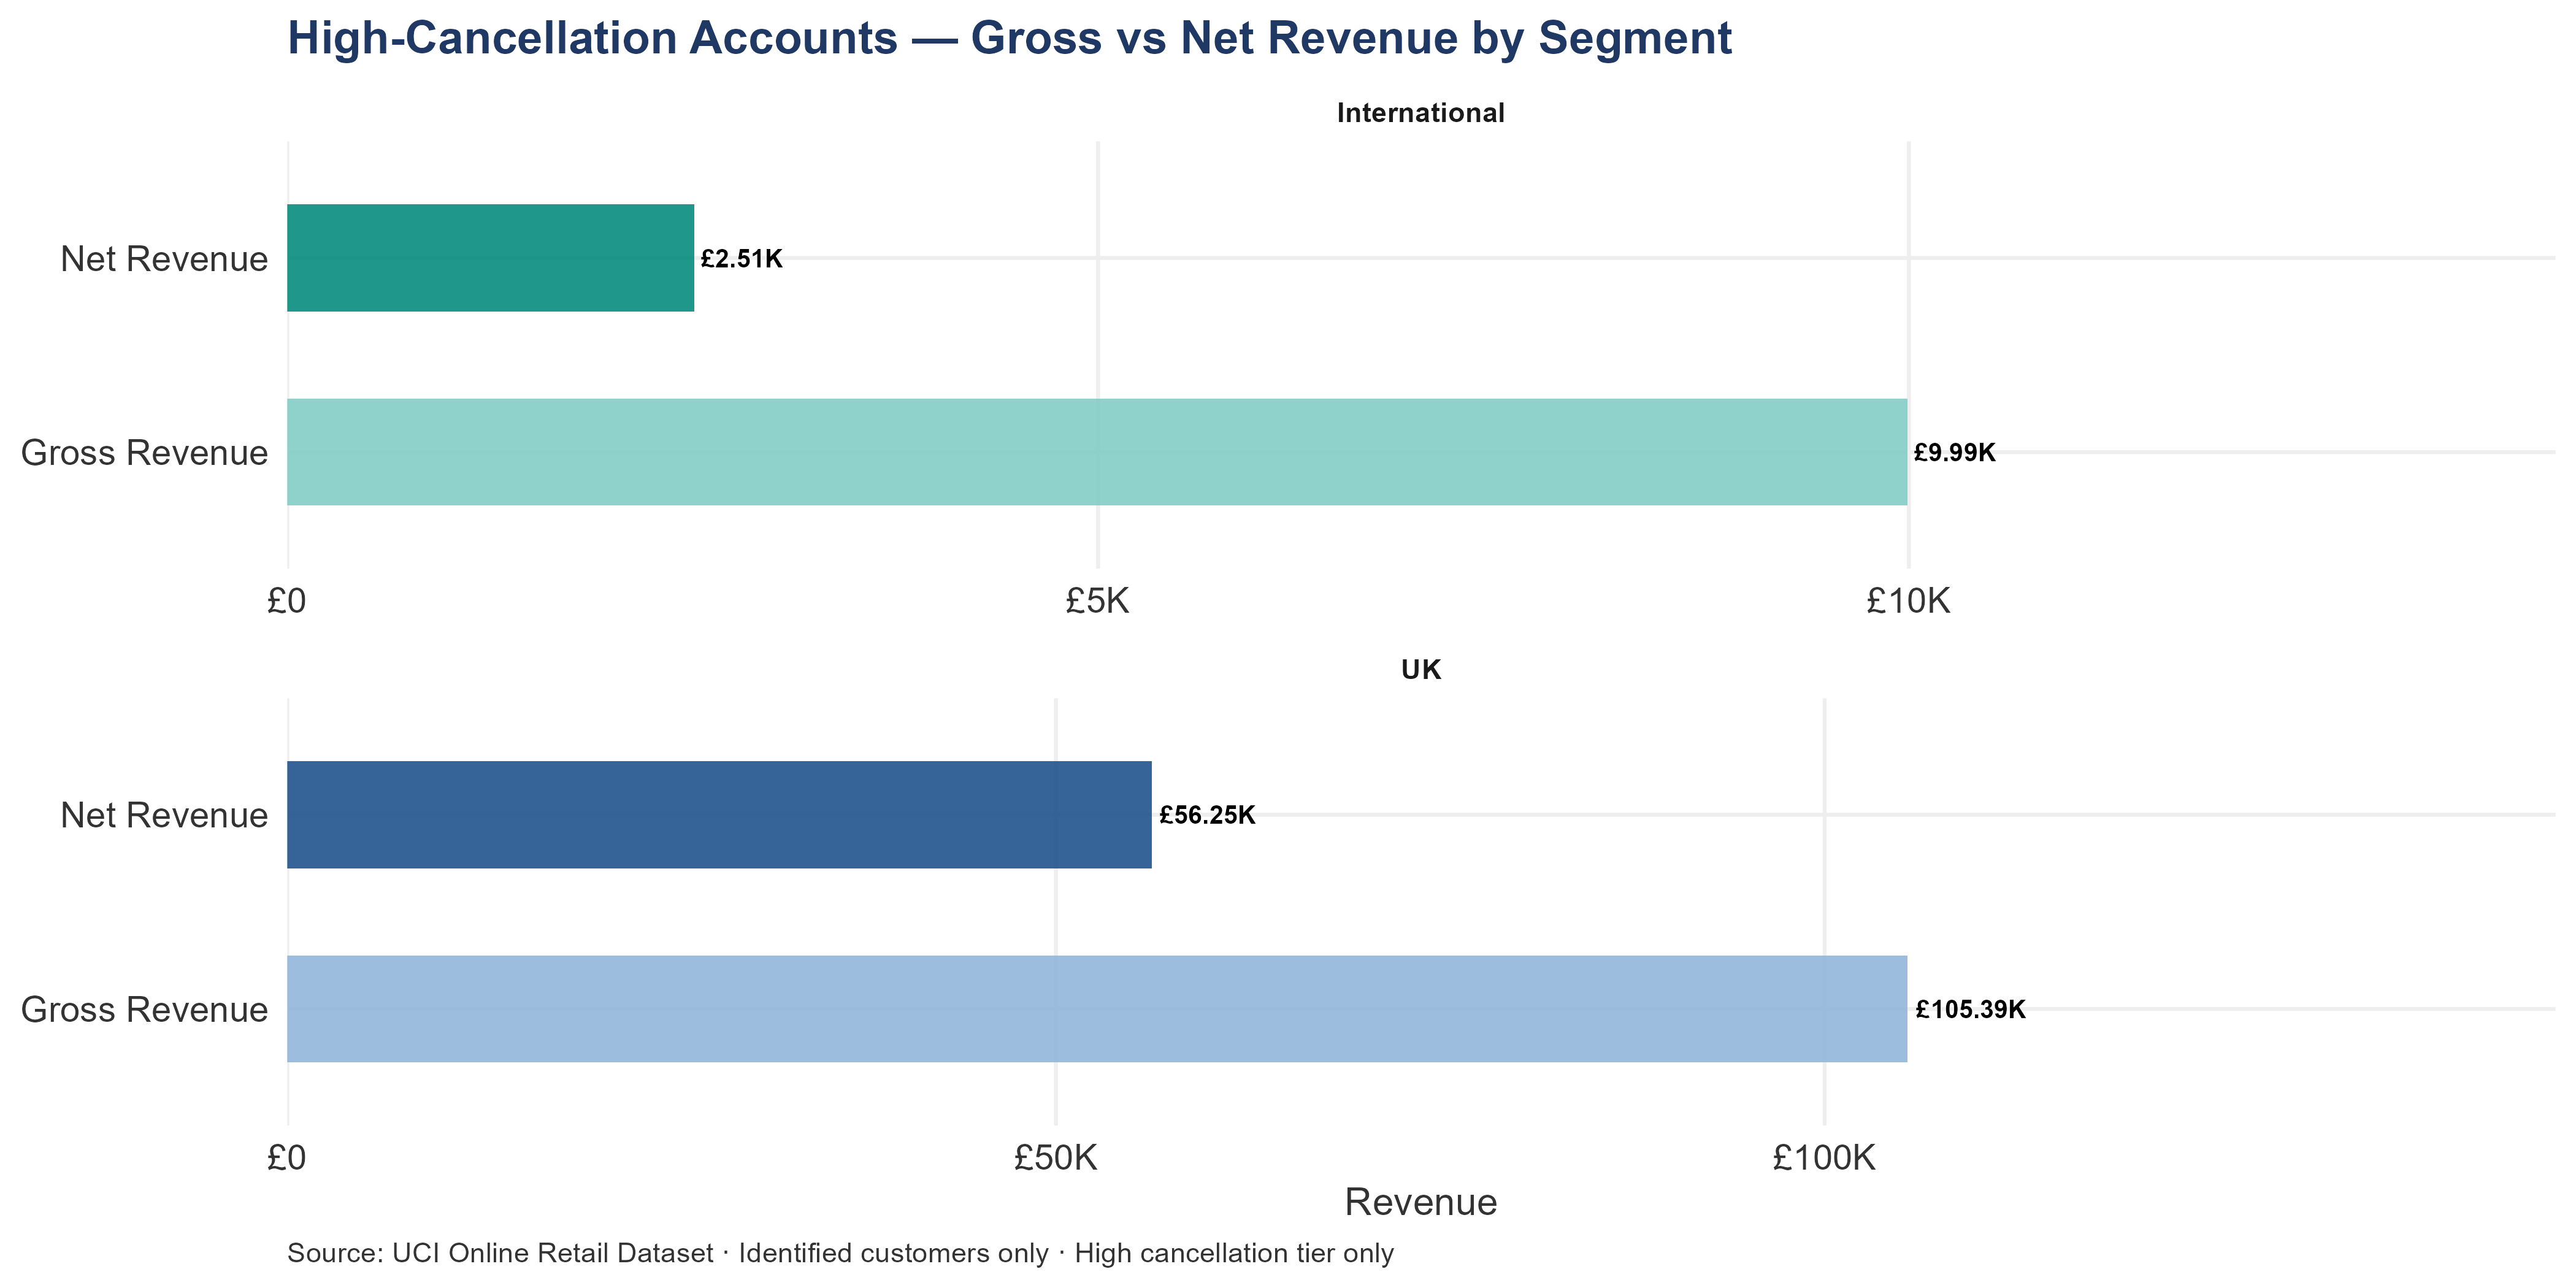
14.2.2 High-Cancellation Accounts — Gross vs Net Revenue
UK high-cancellation accounts show £105.39K invoiced collapsing to £56.25K retained — the gap between the two bars is revenue that was processed, incurred operational cost, and then reversed.
Pre-close DD action: Request operational records for the top 5 UK high-cancellation accounts by cancel value. Cross-reference cancellation dates against stock-out logs, delivery failure reports, and any customer correspondence. The pattern will surface whether these are systemic process failures or account-specific behaviors.
14.2.3 UK Accounts with High Cancellation Rates
Each account is classified into one of three neutral categories based on observed cancellation rate:
- 100% cancellation — cancellation rate ≥99%. Revenue invoiced and almost entirely reversed.
- High cancellation (≥50%) — cancellation rate 50–98%.
- Elevated cancellation (30–49%) — cancellation rate 30–49%.
Three accounts dominate the UK high-cancellation population in revenue terms. Account 15749 invoiced £44.53K gross — more than four times the next largest — and retained only £21.54K after cancellations. Account 14607 invoiced £15.02K across 12 orders with a 34.81% cancellation rate — a high order count combined with a persistent cancellation pattern, which points toward a structural issue rather than a one-off event. Account 15482 invoiced £10.84K across 11 orders with a similar profile. These three accounts are the investigation priorities because they are the accounts where the answer — process problem or account-quality problem — most directly affects the revenue assumption in a valuation model.
| Customer ID | Gross Revenue | Cancellations | Net Revenue | Cancel Rate | Orders 2010 | Orders 2011 | Note |
|---|---|---|---|---|---|---|---|
| 17548 | £103 | £245 | £-141 | 236.96% | 0 | 1 | 100% cancellation |
| 16546 | £787 | £883 | £-96 | 112.19% | 1 | 1 | 100% cancellation |
| 13364 | £135 | £135 | £0 | 100.00% | 0 | 1 | 100% cancellation |
| 13672 | £186 | £186 | £0 | 100.00% | 0 | 2 | 100% cancellation |
| 13762 | £307 | £307 | £0 | 100.00% | 0 | 1 | 100% cancellation |
| 14557 | £788 | £788 | £0 | 100.00% | 0 | 1 | 100% cancellation |
| 14792 | £6 | £6 | £0 | 100.00% | 0 | 1 | 100% cancellation |
| 16878 | £13 | £13 | £0 | 100.00% | 0 | 1 | 100% cancellation |
| 18268 | £26 | £26 | £0 | 100.00% | 0 | 1 | 100% cancellation |
| 18274 | £176 | £176 | £0 | 100.00% | 0 | 1 | 100% cancellation |
| 18072 | £247 | £235 | £12 | 95.05% | 0 | 1 | High cancellation (≥50%) |
| 17900 | £112 | £97 | £15 | 86.63% | 0 | 2 | High cancellation (≥50%) |
| 13217 | £534 | £400 | £134 | 74.98% | 0 | 3 | High cancellation (≥50%) |
| 15221 | £403 | £289 | £114 | 71.70% | 1 | 0 | High cancellation (≥50%) |
| 15973 | £308 | £208 | £100 | 67.59% | 1 | 0 | High cancellation (≥50%) |
| 16716 | £901 | £581 | £320 | 64.51% | 0 | 2 | High cancellation (≥50%) |
| 12908 | £750 | £390 | £360 | 52.00% | 0 | 2 | High cancellation (≥50%) |
| 15749 | £44.53K | £23.00K | £21.54K | 51.64% | 0 | 3 | High cancellation (≥50%) |
| 13587 | £712 | £365 | £347 | 51.29% | 0 | 1 | High cancellation (≥50%) |
| 14205 | £467 | £238 | £228 | 51.04% | 0 | 2 | High cancellation (≥50%) |
| 17867 | £1.16K | £574 | £584 | 49.60% | 0 | 6 | Elevated cancellation (30–49%) |
| 14304 | £383 | £186 | £197 | 48.60% | 0 | 1 | Elevated cancellation (30–49%) |
| 16163 | £857 | £415 | £442 | 48.45% | 1 | 1 | Elevated cancellation (30–49%) |
| 16801 | £1.59K | £752 | £842 | 47.16% | 0 | 4 | Elevated cancellation (30–49%) |
| 13984 | £921 | £432 | £488 | 46.98% | 1 | 4 | Elevated cancellation (30–49%) |
| 14410 | £1.10K | £512 | £587 | 46.56% | 0 | 9 | Elevated cancellation (30–49%) |
| 14109 | £144 | £64 | £80 | 44.38% | 0 | 1 | Elevated cancellation (30–49%) |
| 17190 | £445 | £195 | £250 | 43.85% | 0 | 2 | Elevated cancellation (30–49%) |
| 14586 | £237 | £103 | £134 | 43.48% | 0 | 1 | Elevated cancellation (30–49%) |
| 14149 | £447 | £187 | £259 | 41.91% | 0 | 1 | Elevated cancellation (30–49%) |
| 15482 | £10.84K | £4.49K | £6.35K | 41.39% | 2 | 9 | Elevated cancellation (30–49%) |
| 15073 | £1.04K | £431 | £612 | 41.30% | 0 | 3 | Elevated cancellation (30–49%) |
| 17526 | £1.20K | £489 | £707 | 40.91% | 2 | 2 | Elevated cancellation (30–49%) |
| 13680 | £3.72K | £1.52K | £2.20K | 40.87% | 0 | 4 | Elevated cancellation (30–49%) |
| 15223 | £756 | £301 | £455 | 39.81% | 0 | 2 | Elevated cancellation (30–49%) |
| 14760 | £89 | £35 | £54 | 39.69% | 0 | 1 | Elevated cancellation (30–49%) |
| 18024 | £390 | £153 | £237 | 39.25% | 0 | 2 | Elevated cancellation (30–49%) |
| 15197 | £1.08K | £423 | £656 | 39.20% | 1 | 2 | Elevated cancellation (30–49%) |
| 16424 | £134 | £51 | £83 | 38.19% | 0 | 1 | Elevated cancellation (30–49%) |
| 16859 | £748 | £275 | £473 | 36.73% | 0 | 2 | Elevated cancellation (30–49%) |
| 16660 | £1.27K | £457 | £810 | 36.07% | 0 | 4 | Elevated cancellation (30–49%) |
| 14607 | £15.02K | £5.23K | £9.79K | 34.81% | 0 | 12 | Elevated cancellation (30–49%) |
| 13085 | £416 | £144 | £272 | 34.54% | 0 | 2 | Elevated cancellation (30–49%) |
| 15681 | £1.43K | £480 | £946 | 33.64% | 0 | 5 | Elevated cancellation (30–49%) |
| 16581 | £106 | £35 | £70 | 33.45% | 0 | 1 | Elevated cancellation (30–49%) |
| 15365 | £2.31K | £765 | £1.55K | 33.06% | 0 | 7 | Elevated cancellation (30–49%) |
| 14665 | £1.84K | £577 | £1.26K | 31.45% | 0 | 5 | Elevated cancellation (30–49%) |
| 13791 | £1.52K | £468 | £1.05K | 30.89% | 0 | 2 | Elevated cancellation (30–49%) |
| 16938 | £2.71K | £833 | £1.88K | 30.73% | 0 | 4 | Elevated cancellation (30–49%) |
UK cancellations are highly concentrated: the top 3 high-cancellation accounts drive 66.57% of all UK high-cancellation value.
14.2.4 Known Flagged Accounts — 16446 and 12346
These two accounts were identified as requiring immediate investigation. Their status in the UK cancellation record is confirmed here.
14.2.5 International Cancellations
International cancellations doubled between H1 and H2 — from 1.51% to 2.34% — heading into the highest-revenue period. The cause cannot be determined from transaction data. It could be customer-side supply issues, process deterioration, or a shift in the account mix. Any of those explanations is material. The trend should be assumed significant until the seller provides evidence otherwise.
The international segment invoiced £1.50M in gross revenue. Of that, £31.49K was subsequently cancelled — a segment cancellation rate of 2.10%.
| Segment | Gross Revenue | Cancel Value | Cancel Rate |
|---|---|---|---|
| International | £1.50M | £31.49K | 2.10% |
| UK | £7.00M | £194.66K | 2.78% |
| Whole Business | £10.25M | £478.71K | 4.67% |
For international orders, each cancellation carries additional cost beyond the lost revenue: cross-border shipping already incurred, customs processing, return logistics, and the opportunity cost of inventory committed to an order that was reversed.
14.2.6 International Cancellation Profile
The chart below breaks down international accounts by cancellation tier. The structure mirrors the UK analysis: a large majority of accounts with no or low cancellation rates, and a small tail of accounts where cancellation rates are high enough to distort account-level revenue figures. The key difference is scale — the international segment has fewer accounts, so each high-cancellation account represents a larger share of the segment’s total cancellation exposure.
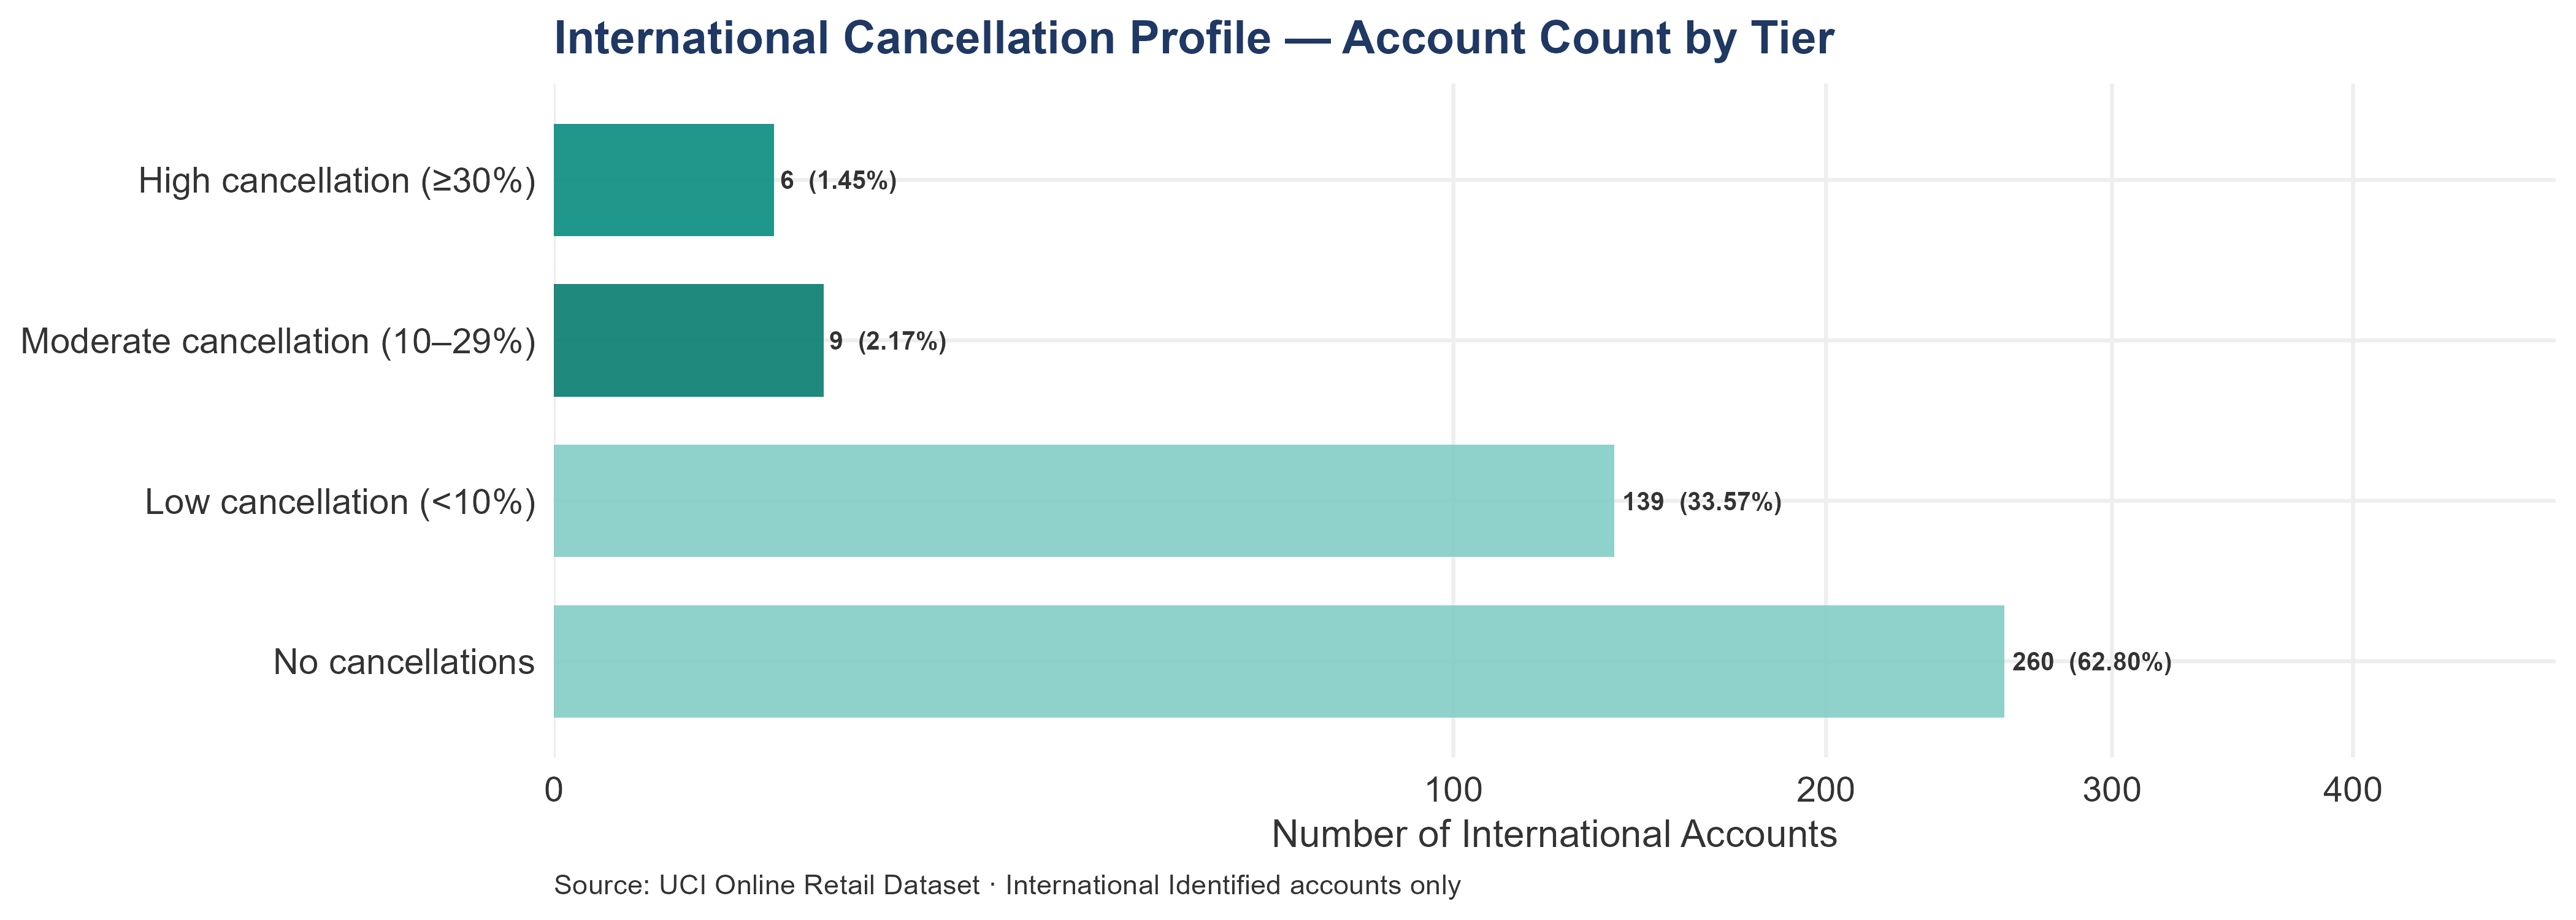
In the international segment, 6 accounts — 1.45% of the base — fall into the high-cancellation tier. These 6 accounts invoiced £9.99K gross and retained only £2.51K net — a gap of £7.48K.
Each high-cancel international account falls into one of three categories: data artifact (exclude from valuation), fulfillment problem (fixable post-close), or deliberate ordering pattern (adjust net revenue expectations).
14.2.7 High-Cancellation Accounts — Gross vs Net Revenue
The international gross-to-net gap is smaller in absolute terms than the UK gap but carries higher embedded cost per pound — each reversed international order has already incurred cross-border shipping and customs processing.
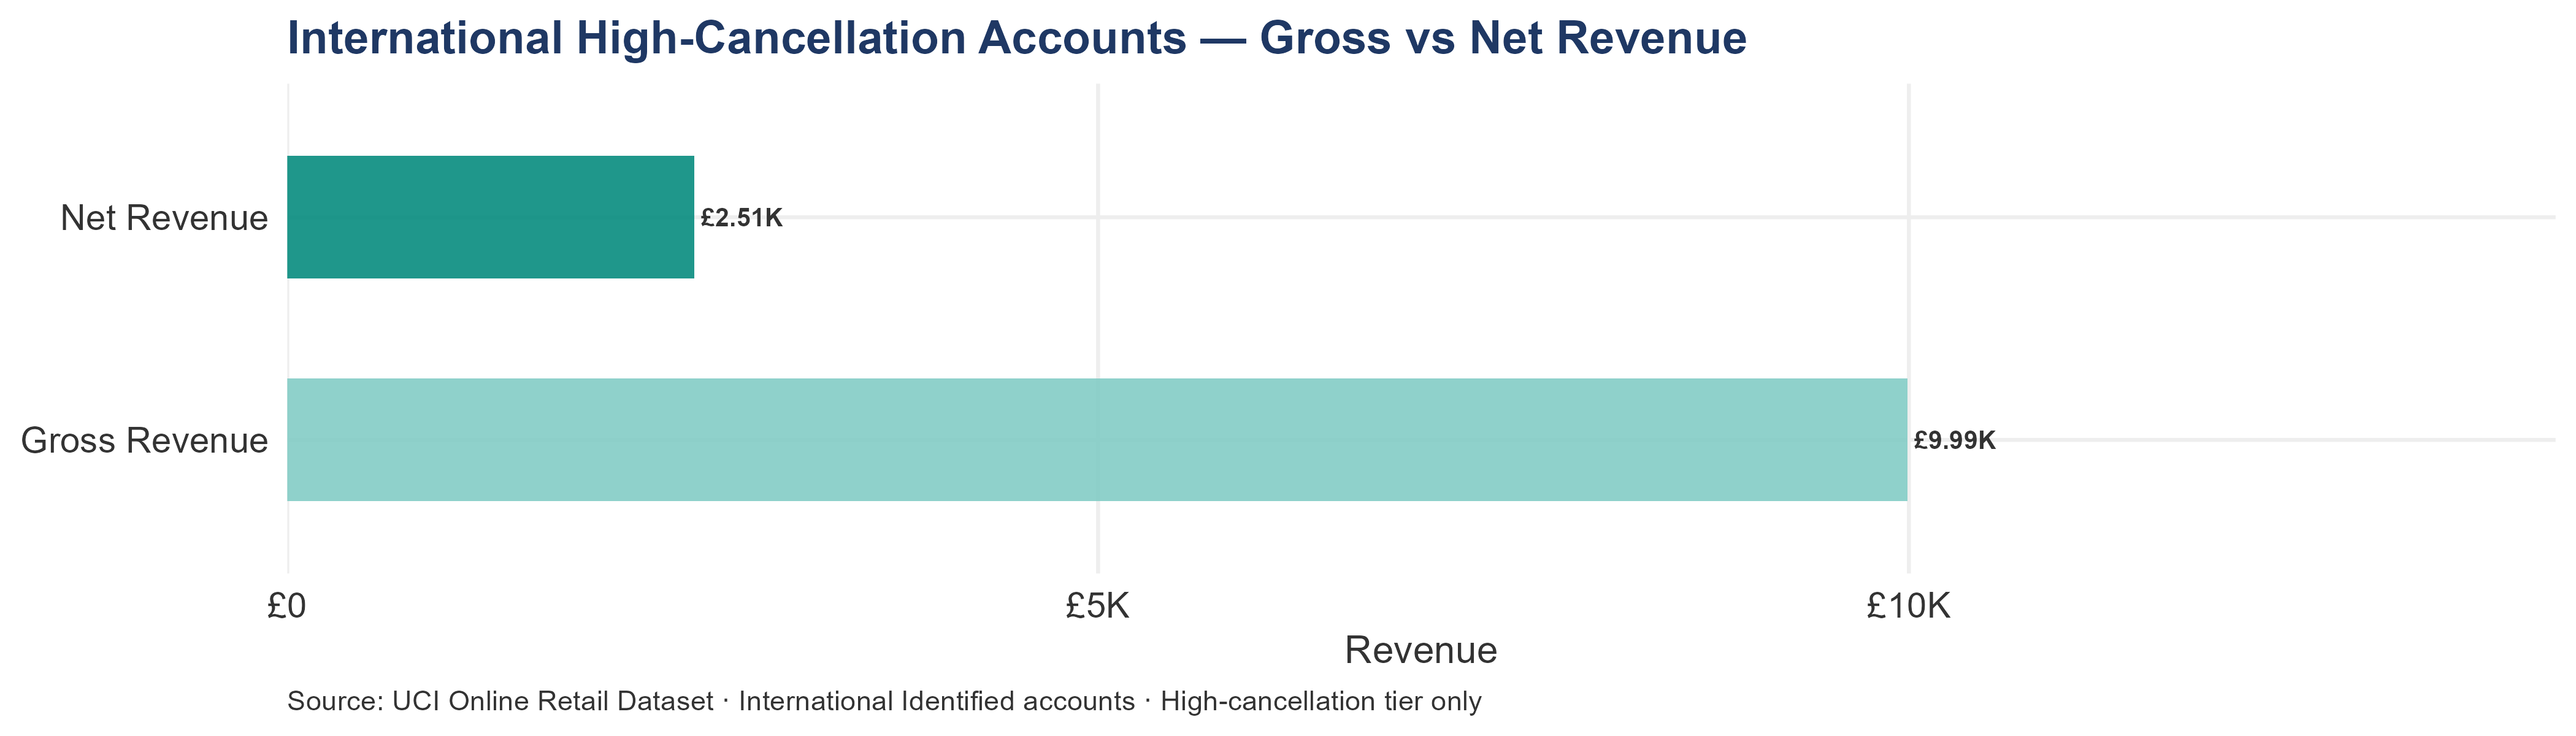
The international gap is smaller in absolute terms than the UK gap — £7.48K versus £49.14K — but each pound of international cancellation carries higher embedded cost. International orders that are subsequently reversed have already incurred cross-border shipping, customs processing, and the opportunity cost of inventory committed to a fulfilled order. The true cost of an international cancellation is the cancel value plus the unrecoverable fulfillment cost, which the transaction data does not capture. The buyer should request the seller’s average international fulfillment cost per order to size this accurately.
14.2.8 International Accounts with High Cancellation Rates
The international high-cancellation population is smaller than the UK equivalent, but each account represents a larger share of the segment’s total cancellation exposure.
| Customer ID | Market | Region | Gross Rev | Net Rev | Cancel Val | Cancel Rate | Orders | Note |
|---|---|---|---|---|---|---|---|---|
| 12454 | Spain | Western Europe | £3.53K | £0 | £3.53K | 100.00% | 1 | 100% cancellation |
| 12558 | USA | Americas | £270 | £0 | £270 | 100.00% | 1 | 100% cancellation |
| 12607 | USA | Americas | £1.58K | £0 | £1.58K | 100.00% | 1 | 100% cancellation |
| 12504 | Germany | Western Europe | £428 | £60 | £368 | 85.98% | 2 | High cancellation (≥50%) |
| 12755 | Japan | Asia-Pacific | £3.81K | £2.22K | £1.59K | 41.74% | 2 | Elevated cancellation (30–49%) |
| 16321 | Australia | Asia-Pacific | £374 | £231 | £143 | 38.26% | 5 | Elevated cancellation (30–49%) |
Three of these six accounts — 12454, 12558, and 12607 — show 100% cancellation rates on a single order each. These are likely data artifacts: test orders, entry errors, or orders placed and immediately reversed before fulfillment. They should be excluded from any account-level revenue projection. The remaining three accounts are the actual investigation targets. Account 12504 in Germany shows an 85.98% cancellation rate across two orders — nearly total reversal, but with a small residual, suggesting partial fulfillment or a negotiated credit. Account 12755 in Japan retained £2.22K of £3.81K gross — a 41.74% rate that is elevated but not catastrophic, and the account placed two orders, indicating ongoing commercial intent. Account 16321 in Australia placed five orders with a 38.26% rate — the most active high-cancellation international account, and the one most likely to reflect a recurring fulfillment or product-fit problem rather than a one-off event.
Pre-close DD action: Contact accounts 12755 and 16321 directly. These are accounts with demonstrated repeat purchasing intent and elevated cancellation rates — exactly the combination where a root-cause conversation can determine whether the problem is fixable post-close.
14.2.9 Top Cancelled Products — International
Whether cancellation value concentrates in a few products or spreads evenly across the top 10 determines whether the problem is product-specific or systemic.
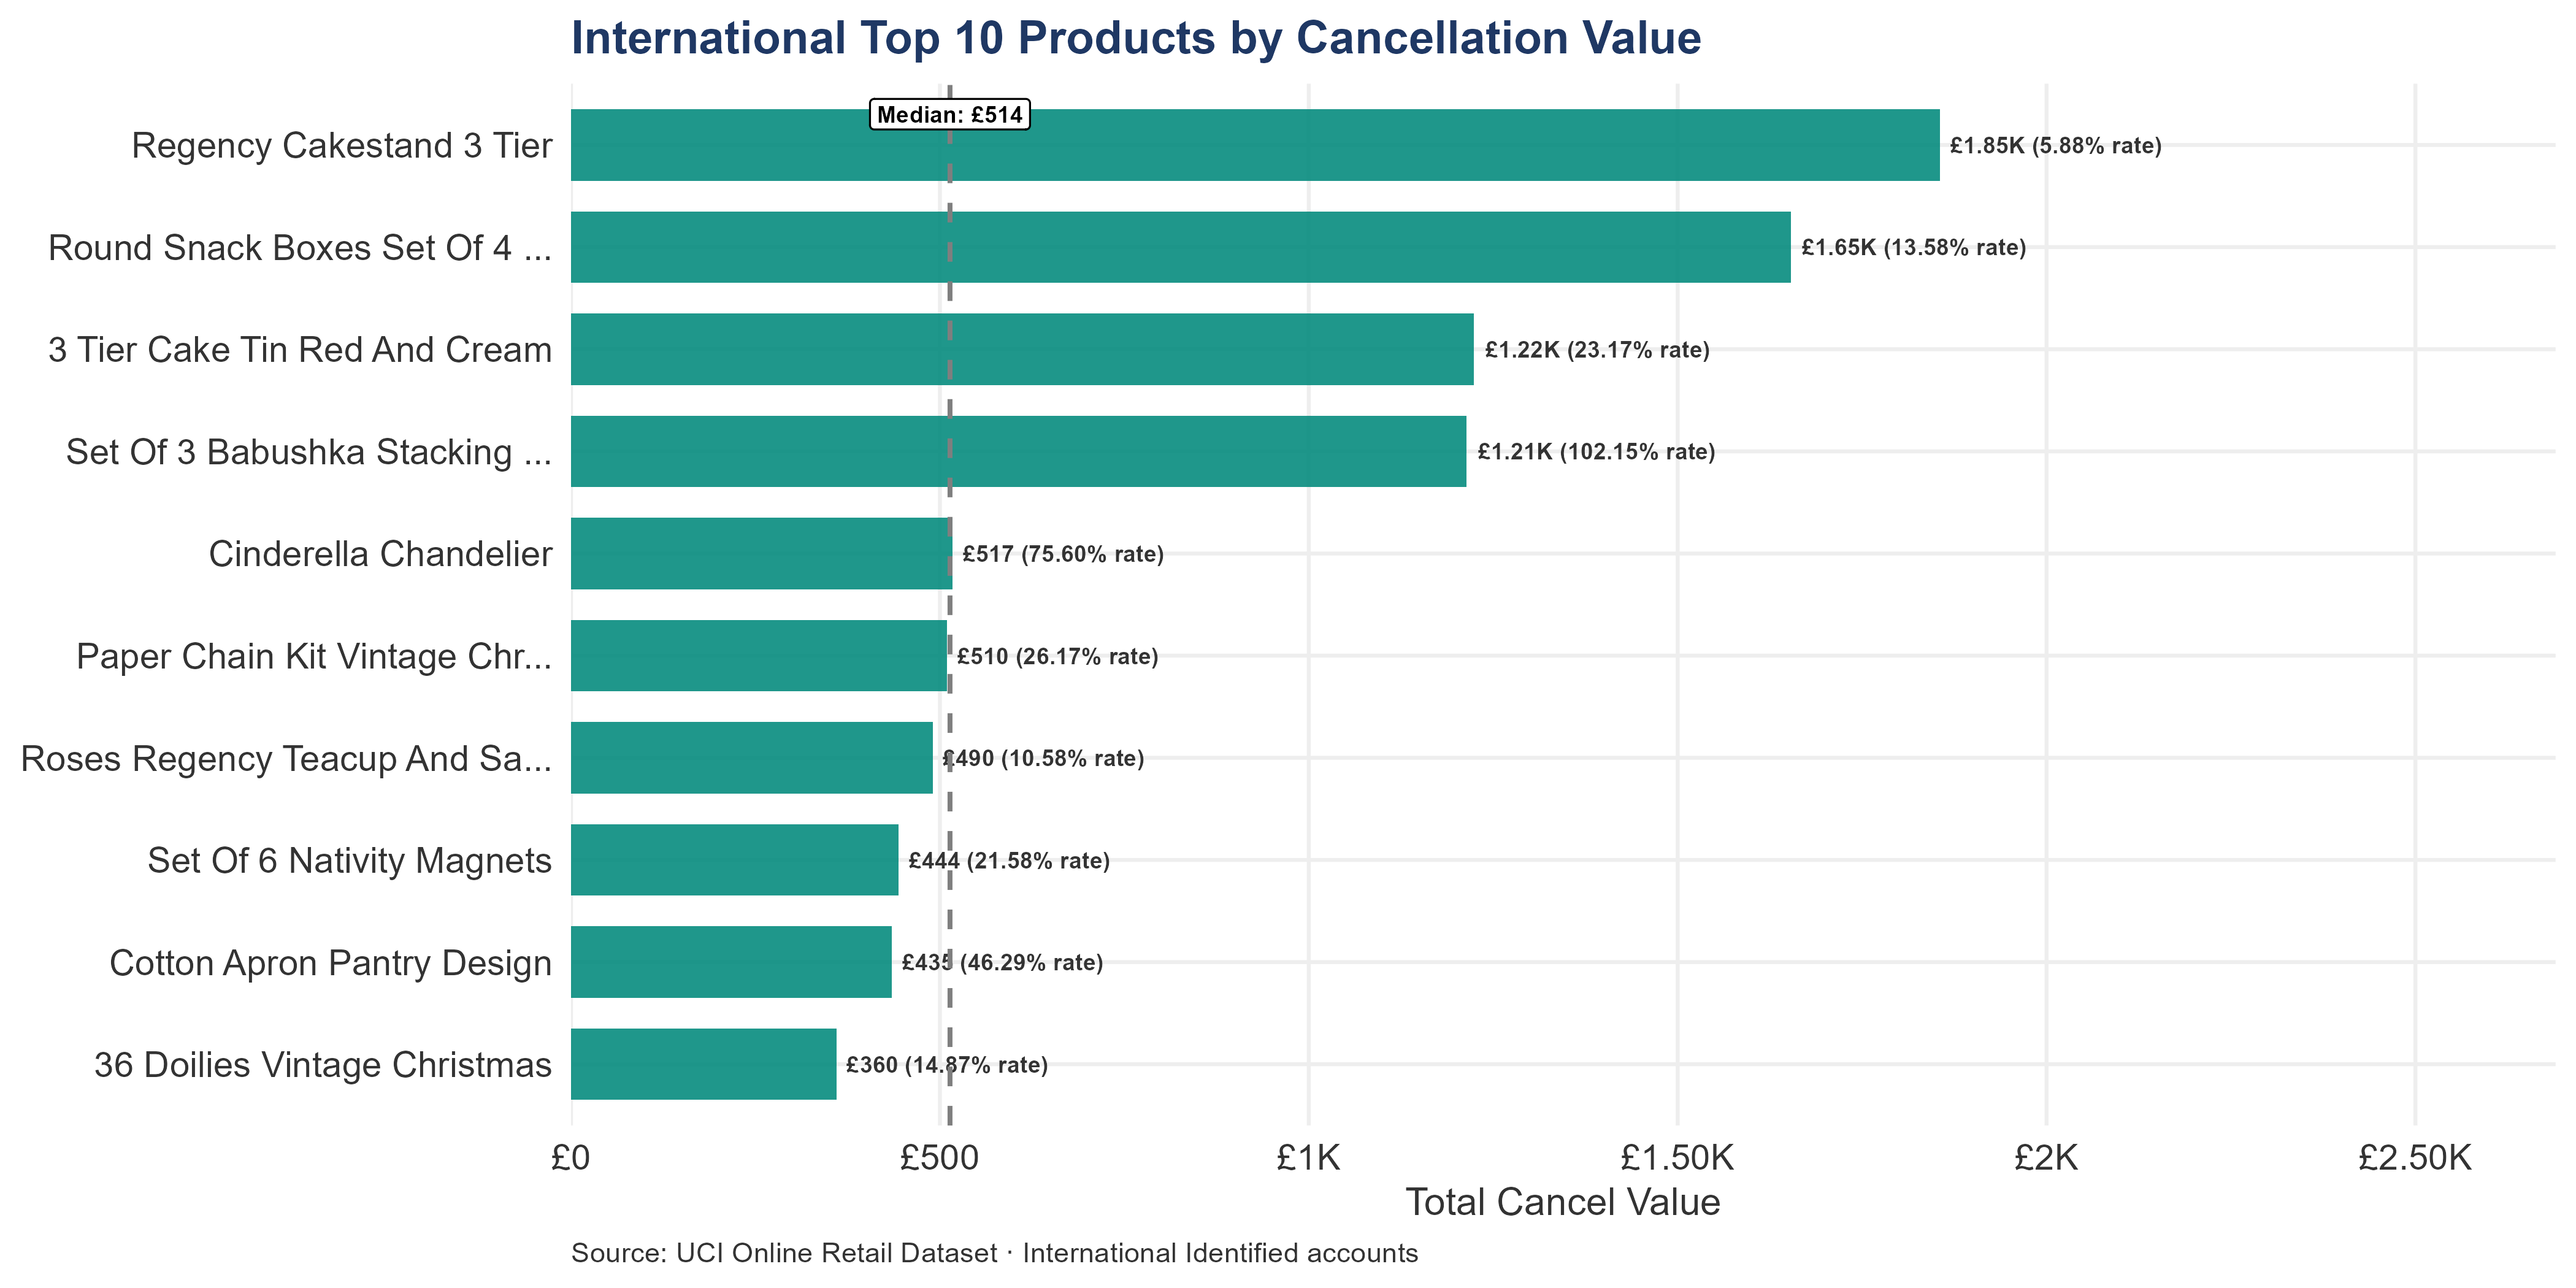
The distribution of international cancellation value across products tells the buyer whether the problem is systemic or product-specific. If cancellation value is spread evenly across the top products, the issue is likely a fulfillment or process problem that affects all international orders. If it is concentrated in one or two products, the issue is product-specific — quality, sizing, description accuracy, or shipping fragility — and can be addressed without overhauling the entire international operation.
14.2.10 Cancellation by Region
Regional variation in cancellation rates distinguishes between account-level problems and systematic fulfillment issues that will persist under new ownership.
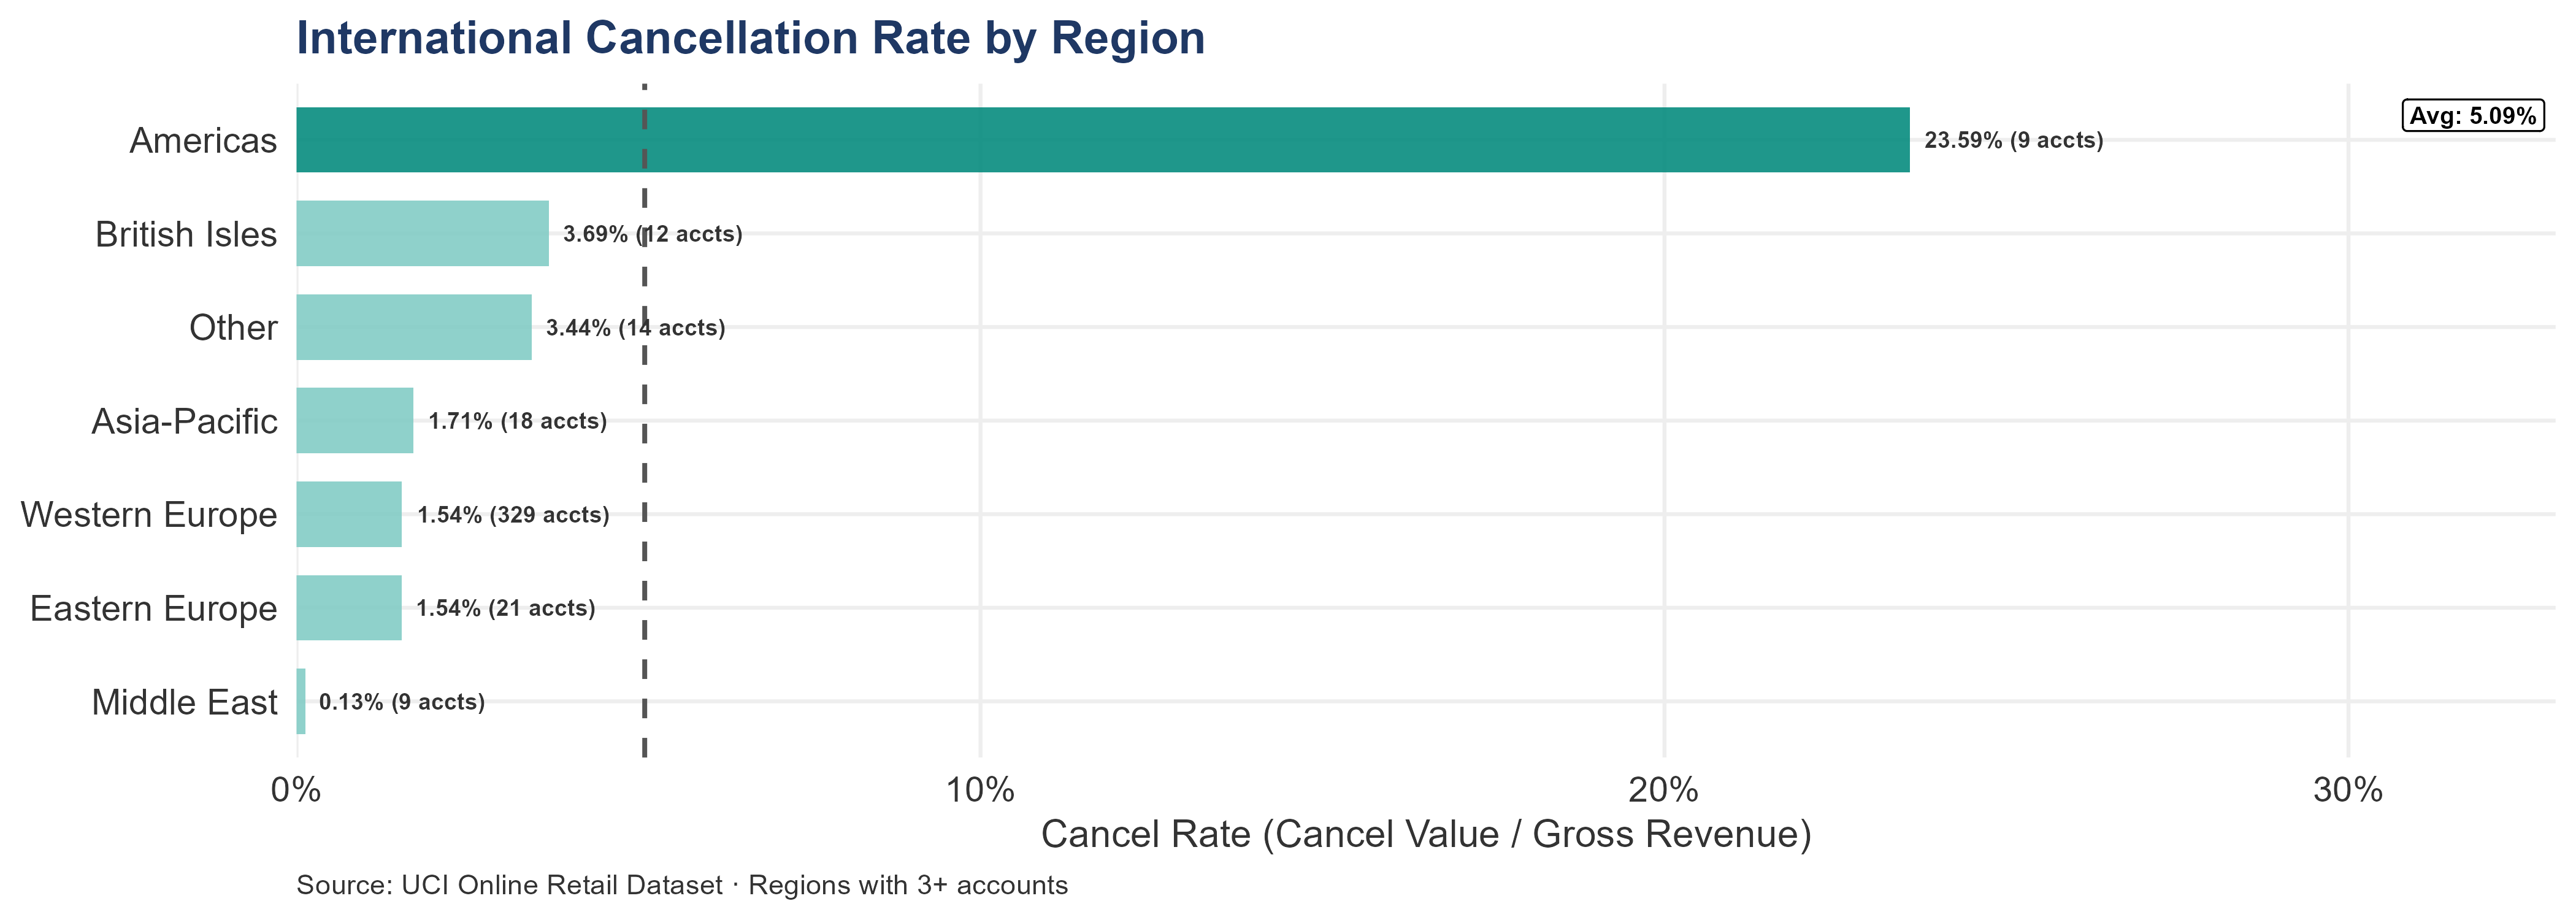
Regional variation in cancellation rates helps distinguish between causes. A region with a high cancellation rate and a small number of accounts may be driven by a single problematic account rather than a regional fulfillment issue. A region with a high rate across many accounts suggests a systematic problem — shipping times, customs complications, or product-market fit — that will persist under new ownership unless addressed. The buyer should cross-reference regions with above-average cancellation rates against the individual account table above to determine which pattern applies.
14.2.11 Top 10 Products — Gross vs Net Revenue Impact
The gap between gross and net revenue on the top 10 international products shows where cancellation-adjusted figures diverge most from the headline numbers.
| Rank | Product | Gross Rev | Cancellations | Net Rev | Cancel Rate |
|---|---|---|---|---|---|
| 1 | Regency Cakestand 3 Tier | £31.53K | £1.85K | £29.67K | 5.88% |
| 2 | Rabbit Night Light | £28.78K | £15 | £28.77K | 0.05% |
| 3 | Round Snack Boxes Set Of4… | £18.07K | £71 | £18.00K | 0.39% |
| 4 | Spaceboy Lunch Box | £14.45K | £4 | £14.44K | 0.03% |
| 5 | Dolly Girl Lunch Box | £12.55K | £323 | £12.23K | 2.57% |
| 6 | Round Snack Boxes Set Of … | £12.17K | £1.65K | £10.52K | 13.58% |
| 7 | Red Toadstool Led Night L… | £10.39K | £34 | £10.36K | 0.33% |
| 8 | Pink 3 Piece Polkadot Cut… | £9.97K | £0 | £9.97K | 0.00% |
| 9 | Set Of 3 Regency Cake Tins | £8.43K | £190 | £8.24K | 2.26% |
| 10 | Plasters In Tin Woodland … | £8.05K | £45 | £8.00K | 0.55% |
The cancellation problem in the international top-10 product list is not evenly distributed. Most of these products show cancellation rates at or below 3% — well within normal wholesale benchmarks. The products with elevated rates are the ones that require investigation. A cancellation rate above 10% on a top-10 product means the gross revenue figure for that product materially overstates its net contribution, and any inventory planning, reorder forecasting, or margin calculation built on gross figures for that product is working from inflated numbers.
Pre-close DD action: For any international top-10 product with a cancellation rate above 10%, request the seller’s return and credit-note records. Determine whether the cancellations are concentrated in specific accounts (an account-quality problem) or spread across many accounts (a product-quality or fulfillment problem). The answer determines whether the fix is account management or product/logistics improvement.
14.2.12 H1 vs H2 Cancellation Trend
The H1-to-H2 cancellation trajectory shows whether the international cancellation problem is stable or accelerating heading into peak season.
| Period | Gross Revenue | Cancel Value | Cancel Rate |
|---|---|---|---|
| H1 2011 (Jan–Jun) | £624.52K | £9.44K | 1.51% |
| H2 2011 (Jul–Dec) | £872.40K | £22.05K | 2.53% |
Trend: The international cancellation rate moved from 1.51% in H1 to 2.53% in H2 — a 67% increase. The cancellation rate nearly doubled from the first half to the second. H2 is when international order values are highest (Q4 seasonal demand) and when the business needs its fulfillment pipeline to be cleanest.
14.3 Pricing Risk
14.3.1 How Consistent Is the Pricing?
The same products are invoiced at materially different prices to different customers, with coefficients of variation above 15% for multiple SKUs. This could be intentional volume-tier pricing or accumulated informal discounting. The transaction record alone cannot distinguish between the two. What it can tell: there is no visible policy governing the variation.
The coefficient of variation (CV) expresses how much a product’s price varies across customers. A CV of 5% means prices are tightly clustered; above 15%, prices vary widely enough that high-revenue products carry meaningful absolute margin exposure.
Undocumented pricing variance creates two problems. First, margin leakage — every informal discount outside a deliberate strategy is margin not captured. Second, fairness exposure — customers who compare invoices and discover unexplained price differences present a relationship problem on top of a margin problem.
A comparison of median unit prices for each of the top-10 products by net revenue, across UK Identified and International Identified customers.
| Product Name | Stock Code | UK Median Price | UK Price CV | Intl Median Price | Intl vs UK Differential | Flag |
|---|---|---|---|---|---|---|
| Rabbit Night Light | 23084 | £2.08 | 13.4% · Moderate — monitor | £1.79 | -13.9% | ⚠ Investigate |
| Paper Chain Kit 50’S … | 22086 | £2.95 | 12.5% · Moderate — monitor | £2.95 | +0% | ✓ Consistent |
| Small Popcorn Holder | 22197 | £0.85 | 11.5% · Moderate — monitor | £0.85 | +0% | ✓ Consistent |
| Regency Cakestand 3 Tier | 22423 | £12.75 | 10.4% · Moderate — monitor | £12.75 | +0% | ✓ Consistent |
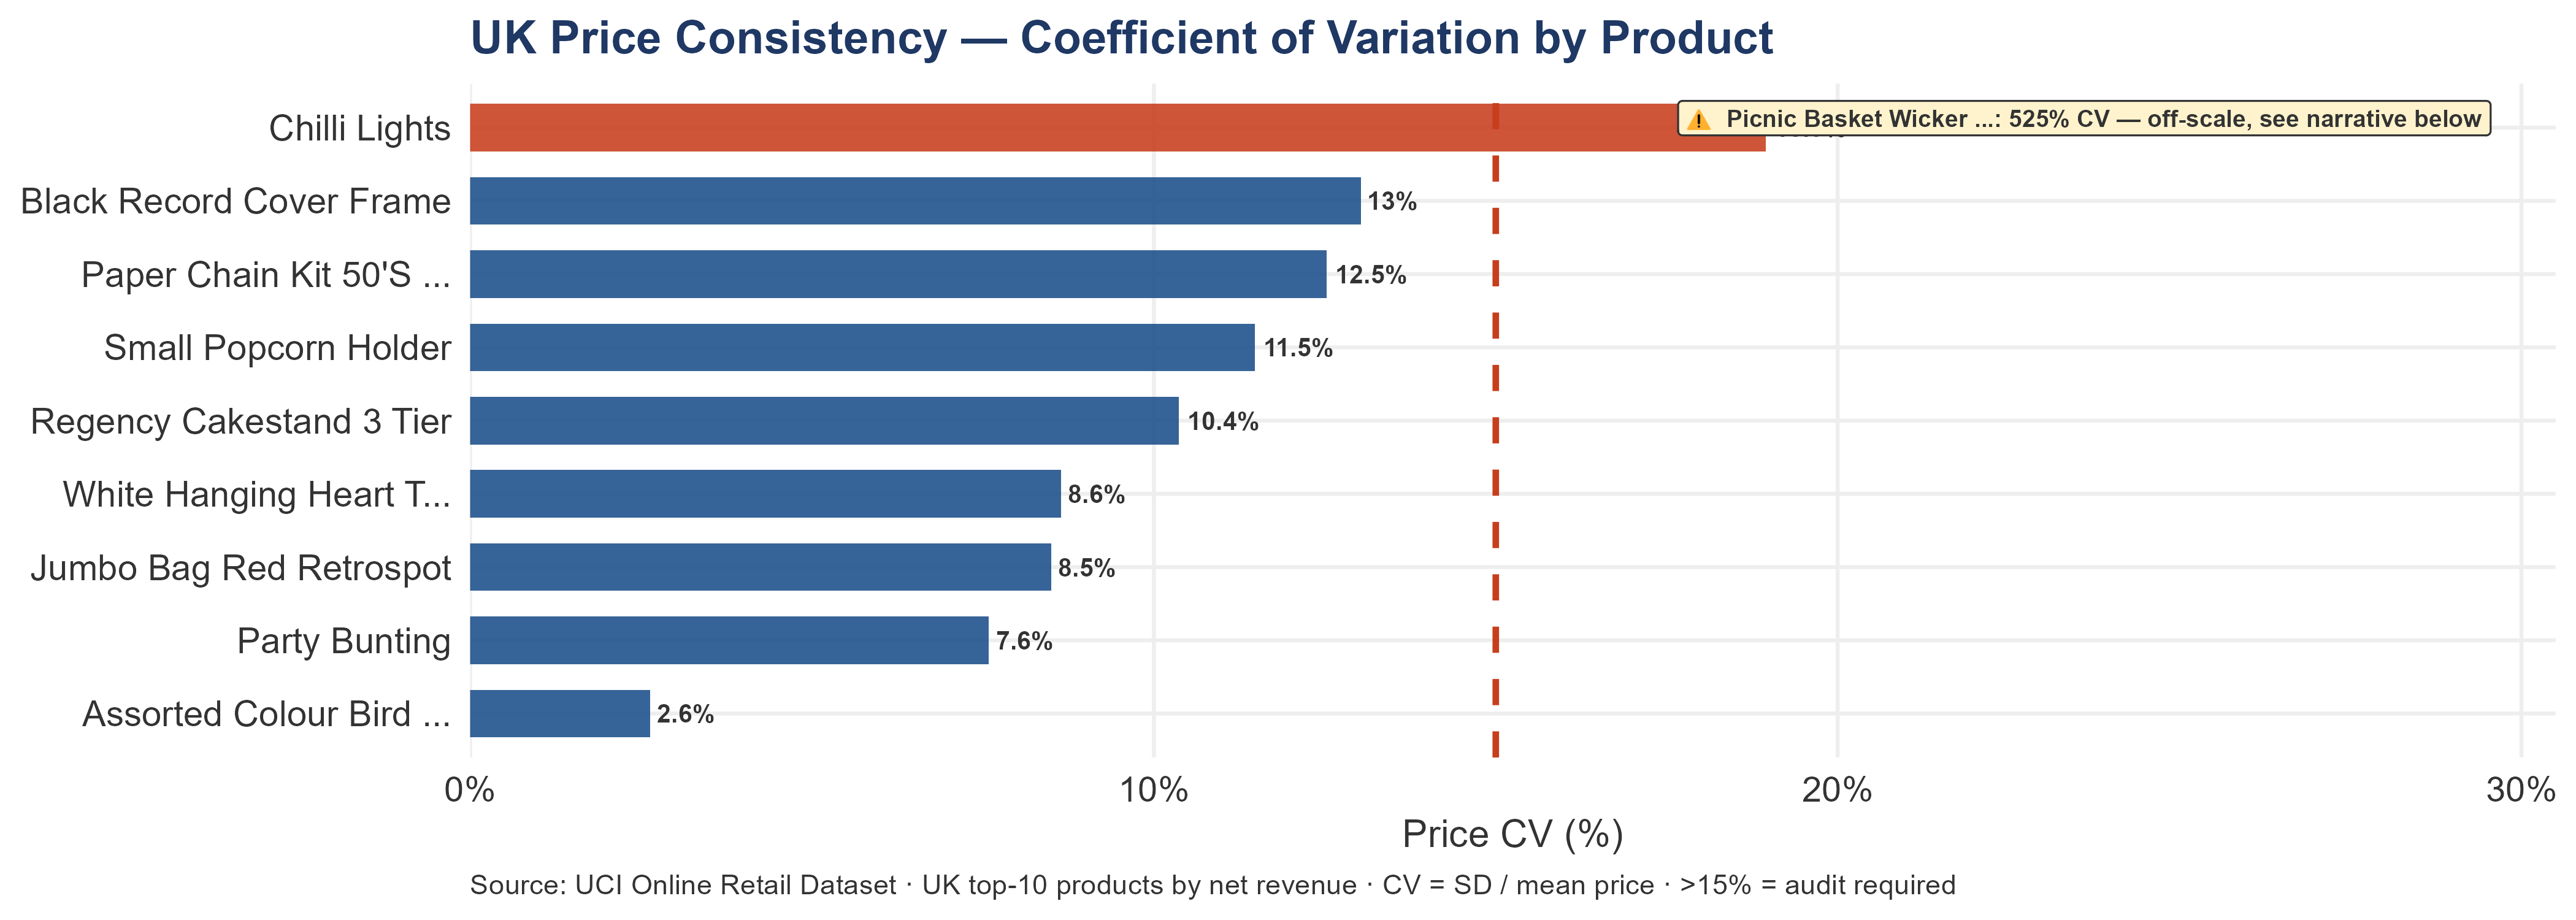
| Picnic Basket Wicker … | 22502 | £5.95 | 524.5% · High — audit required | £5.95 | +0% | ✓ Consistent |
| Party Bunting | 47566 | £4.95 | 7.6% · Moderate — monitor | £4.95 | +0% | ✓ Consistent |
| Chilli Lights | 79321 | £5.75 | 18.9% · High — audit required | £5.75 | +0% | ✓ Consistent |
| Assorted Colour Bird … | 84879 | £1.69 | 2.6% · Tight — consistent pricing | £1.69 | +0% | ✓ Consistent |
| Jumbo Bag Red Retrospot | 85099B | £2.08 | 8.5% · Moderate — monitor | £2.08 | +0% | ✓ Consistent |
| White Hanging Heart T… | 85123A | £2.95 | 8.6% · Moderate — monitor | £2.95 | +0% | ✓ Consistent |
For 8 of the top 10 products, international customers pay the same median price as UK customers — consistent pricing across segments. Only Rabbit Night Light shows a meaningful differential (international pays 13.9% less than UK). Every differential above ±10% requires a CFO policy decision before the next Q4 cycle.
Consistent cross-segment pricing is a governance positive — it means the business has not been systematically discounting to international accounts to win business. The Rabbit Night Light differential is the exception: 13.9% below UK price for international customers requires investigation before the first Q4 under new ownership.
Picnic Basket Wicker — 524% CV is not a pricing problem. The Picnic Basket shows a CV of 524% — explained by a single anomalous high-price transaction at approximately £649.50 per unit against a typical price of around £9.95. One extreme outlier inflates both standard deviation and mean. The median price (£9.95) is the correct reference for normal pricing governance on this product.
Chilli Lights — 42.3% CV is a pricing audit. Chilli Lights shows 42.3% full-year CV — above the 15% audit threshold. At a median price of approximately £5.75, the transaction-level price range spans approximately £3.82 to £17.88 per unit — a £14.06 spread.
Revenue recovery opportunity: At the 4-week demand projection of 1,997 units, the difference between selling at the bottom versus top of the current price range is approximately £28.08K for one 4-week window. The annual consequence: approximately £365.01K.
The CV trend matters as much as the current level. A product at 12% CV trending upward from 6% six months ago is a different risk profile from one that has been stable at 12% all year.
| Product | Stock Code | H1 CV (%) | H2 CV (%) | Trend | Flag |
|---|---|---|---|---|---|
| Chilli Lights | 79321 | 39.2 | 43.9 | ↑ Worsening — escalate to audit | ⚠ Audit required |
| Party Bunting | 47566 | 36.5 | 37.1 | → Stable | ⚠ Audit required |
| Rabbit Night Light | 23084 | 33.4 | 36.6 | ↑ Worsening — escalate to audit | ⚠ Audit required |
| Medium Ceramic Top Storag… | 23166 | 29.8 | 35 | ↑ Worsening — escalate to audit | ⚠ Audit required |
| Jumbo Bag Red Retrospot | 85099B | 37.7 | 33.9 | ↓ Improving | ⚠ Audit required |
| Paper Chain Kit 50’S Chri… | 22086 | 33.9 | 32.7 | → Stable | ⚠ Audit required |
| Regency Cakestand 3 Tier | 22423 | 28.3 | 31.9 | ↑ Worsening — escalate to audit | ⚠ Audit required |
| White Hanging Heart T-Lig… | 85123A | 24.3 | 27.2 | → Stable | ⚠ Audit required |
| Assorted Colour Bird Orna… | 84879 | 14.6 | 14.7 | → Stable | |
| Paper Craft Little Birdie | 23843 | — | — | Insufficient data |
Products where H2 CV exceeds H1 by more than 3 percentage points are worsening and should be escalated to audit regardless of absolute level. Products already above 15% in either half are immediate priorities.
14.4 UK Pricing Architecture
UK products flagged with CV above 15% require a pricing audit within 90 days. Whether the variance is intentional tiering or unmanaged discounting, the resolution is the same: document it as formal policy.
A total of 2 of the UK top-10 products have a price CV above 15%. Products below 15% are within an acceptable range but should be monitored for worsening trend in the H1/H2 table below.
A price CV above 15% on a top-10 product means some UK accounts are paying materially less than others for the same item. For an acquirer, this creates three risks: enforcing list pricing post-close may create account friction; undisclosed contractual discounts reduce forward margin; and the extreme Picnic Basket Wicker CV may reflect a unit-of-measure data entry error rather than actual discounting.
14.4.1 Price Comparison Across Customer Types
Median unit prices for each top-10 product compared across UK Identified, International Identified, and Anonymous customers.
UK median price vs. what International and Anonymous customers pay for the same products.
| Product | UK Median | UK Price CV | Intl Median | Intl vs UK | Anon Median | Anon vs UK | Flag |
|---|---|---|---|---|---|---|---|
| Black Record Cover Frame | £3.75 | 13% · Moderate — monitor | £3.75 | +0% | £7.46 | +98.9% | ✓ Consistent |
| Paper Chain Kit 50’S … | £2.95 | 12.5% · Moderate — monitor | £2.95 | +0% | £5.79 | +96.3% | ✓ Consistent |
| Small Popcorn Holder | £0.85 | 11.5% · Moderate — monitor | £0.85 | +0% | £1.63 | +91.8% | ✓ Consistent |
| Regency Cakestand 3 Tier | £12.75 | 10.4% · Moderate — monitor | £12.75 | +0% | £24.96 | +95.8% | ✓ Consistent |
| Picnic Basket Wicker … | £5.95 | 524.5% · High — audit required | £5.95 | +0% | £8.47 | +42.4% | ✓ Consistent |
| Party Bunting | £4.95 | 7.6% · Moderate — monitor | £4.95 | +0% | £10.79 | +118% | ✓ Consistent |
| Chilli Lights | £5.75 | 18.9% · High — audit required | £5.75 | +0% | £12.46 | +116.7% | ✓ Consistent |
| Assorted Colour Bird … | £1.69 | 2.6% · Tight | £1.69 | +0% | £3.12 | +84.6% | ✓ Consistent |
| Jumbo Bag Red Retrospot | £2.08 | 8.5% · Moderate — monitor | £2.08 | +0% | £4.13 | +98.6% | ✓ Consistent |
| White Hanging Heart T… | £2.95 | 8.6% · Moderate — monitor | £2.95 | +0% | £5.79 | +96.3% | ✓ Consistent |
Anonymous customers pay approximately 94% more than UK Identified customers across the top-10 products. This reflects the difference between retail-adjacent anonymous ordering and negotiated wholesale pricing for identified accounts.
14.4.2 Price Consistency Trend — H1 vs H2 2011
UK products flagged with CV above 15% require a pricing audit within 90 days. Whether the variance is intentional tiering or unmanaged discounting, the resolution is the same: document it as formal policy.
| Product | Stock Code | H1 CV (%) | H2 CV (%) | Flag |
|---|---|---|---|---|
| Chilli Lights | 79321 | 39.2 | 43.9 | ⚠ Audit required |
| Small Popcorn Holder | 22197 | 34.2 | 38.8 | ⚠ Audit required |
| Party Bunting | 47566 | 36.5 | 37.1 | ⚠ Audit required |
| Black Record Cover Frame | 21137 | 26.3 | 35.0 | ⚠ Audit required |
| Jumbo Bag Red Retrospot | 85099B | 37.7 | 33.9 | ⚠ Audit required |
| Paper Chain Kit 50’S Chri… | 22086 | 33.9 | 32.7 | ⚠ Audit required |
| Regency Cakestand 3 Tier | 22423 | 28.3 | 31.9 | ⚠ Audit required |
| Picnic Basket Wicker Small | 22502 | 433.3 | 27.2 | ⚠ Audit required |
| White Hanging Heart T-Lig… | 85123A | 24.3 | 27.2 | ⚠ Audit required |
| Assorted Colour Bird Orna… | 84879 | 14.6 | 14.7 |
14.5 International Pricing Analysis
International pricing is inherently more complex. Currency, shipping, volume tiers, and market-specific conditions all create legitimate reasons for variation. The requirement is not uniform pricing. It is a documented policy that explains what variation is permitted and why. Without that, the business cannot distinguish intentional pricing from errors.
14.5.2 Price Consistency — International Products
International pricing carries inherent complexity — currency, shipping, volume tiers, and market-specific conditions all create legitimate variation. The requirement is not uniform pricing but a documented policy explaining what variation is permitted and why.
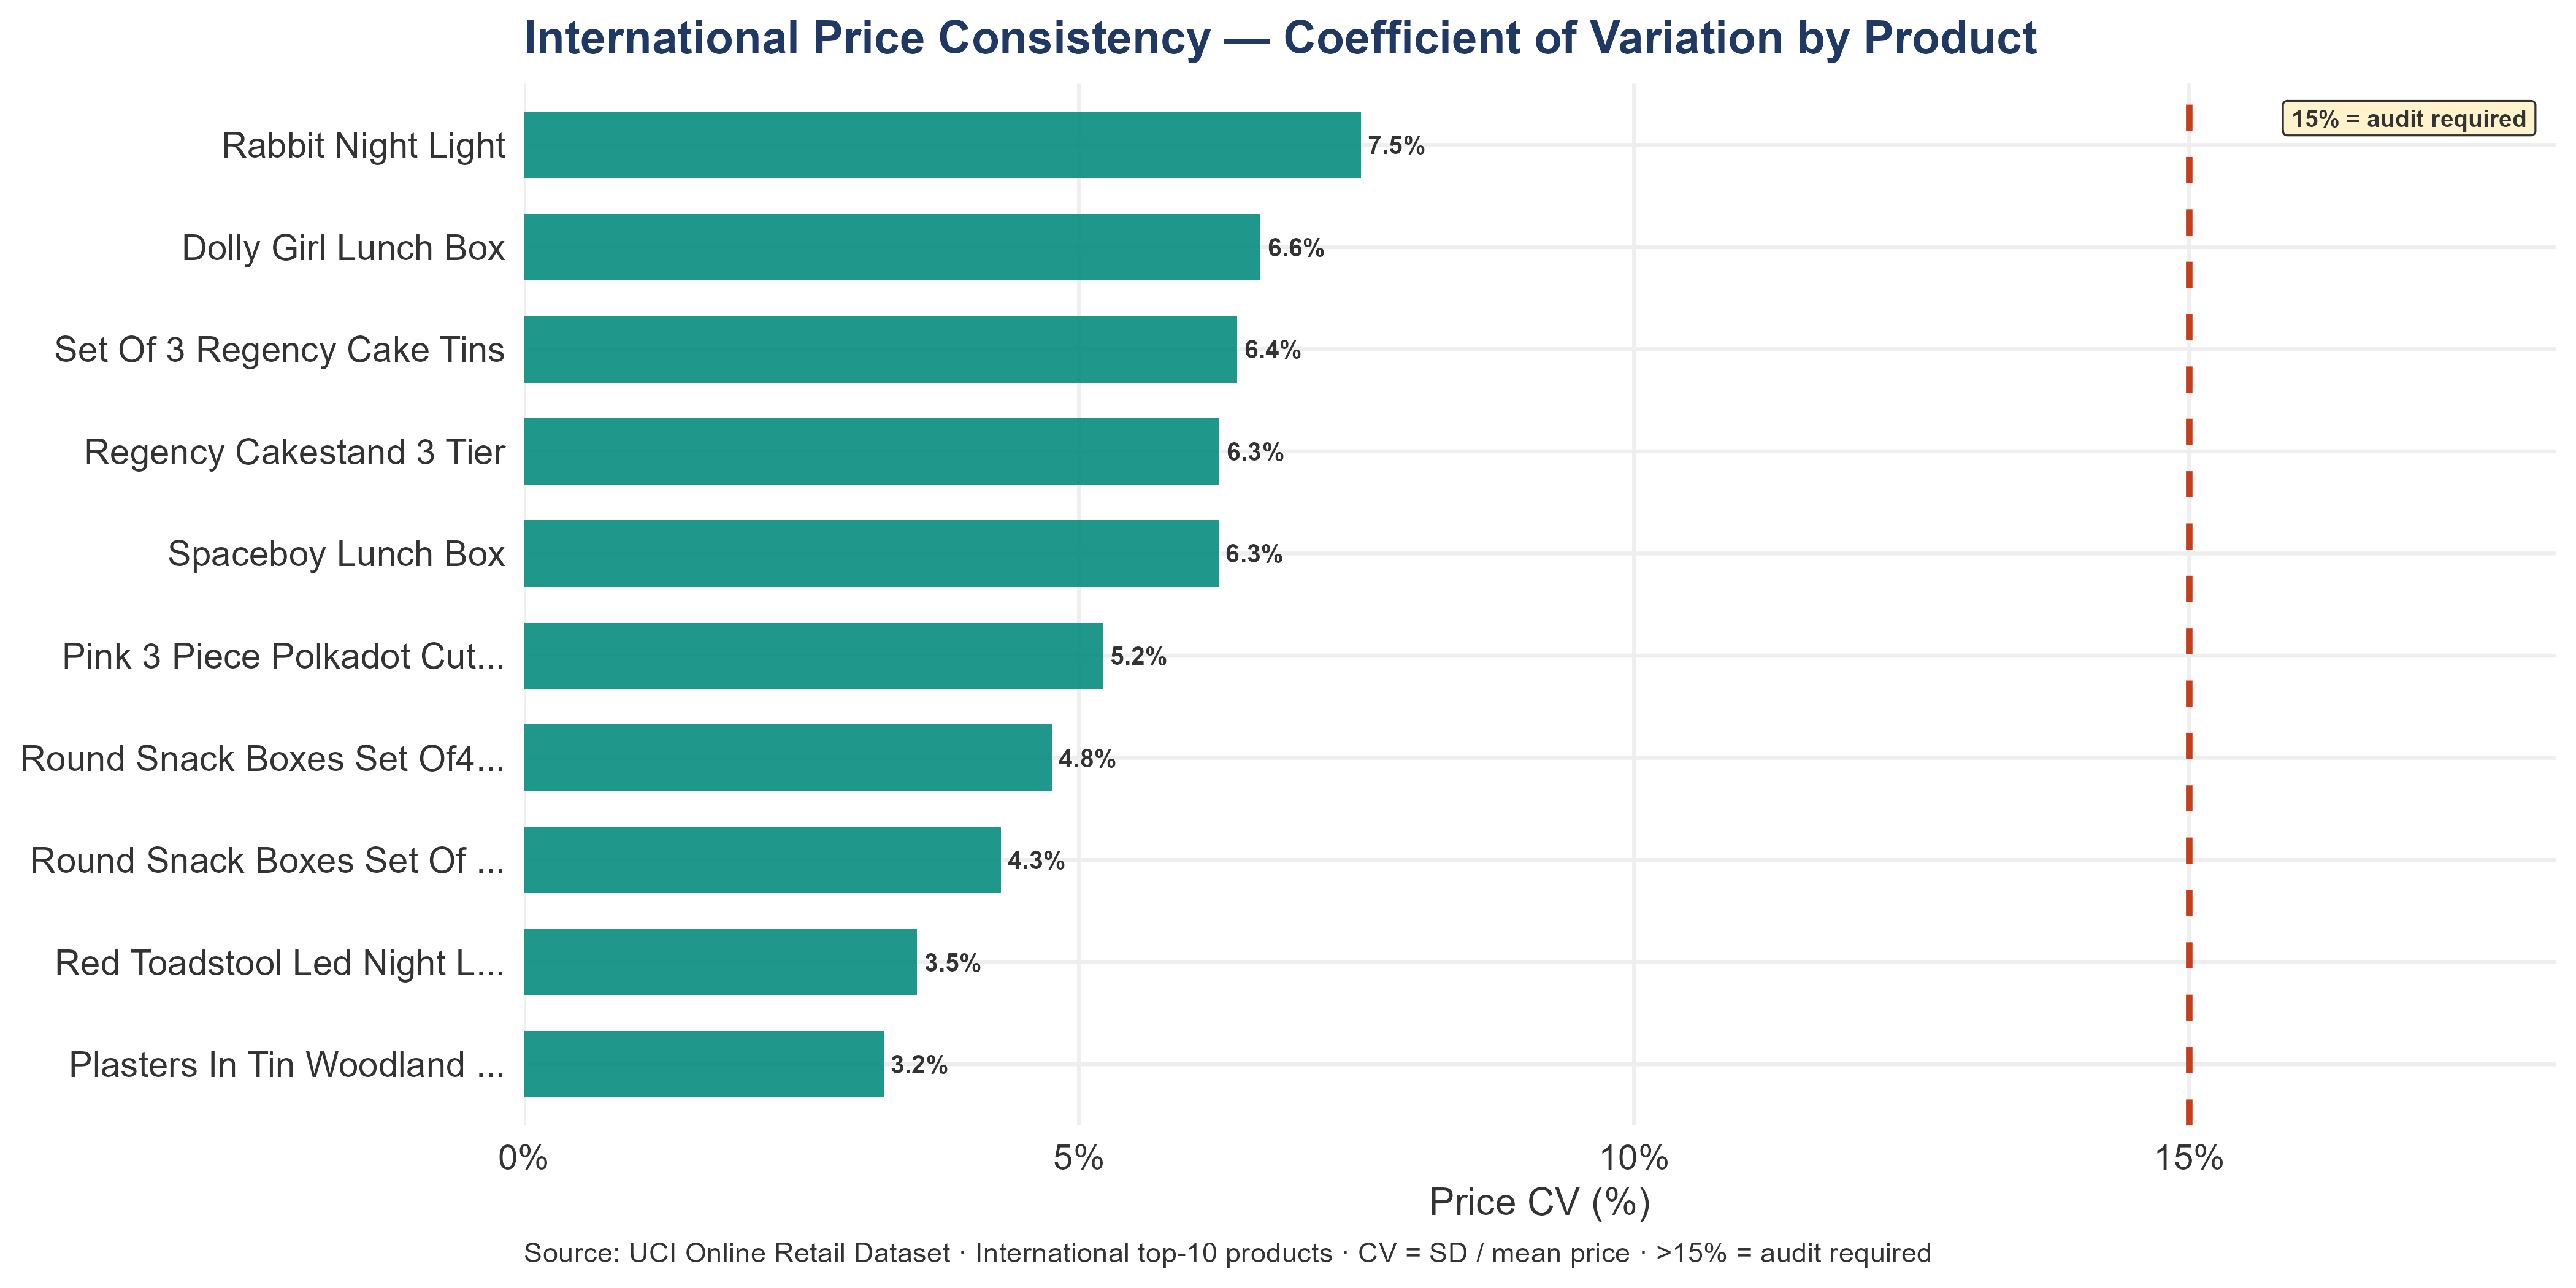
None of the international top-10 products have a price CV above 15%. This is a positive signal — international pricing is consistent across accounts for all top products. No immediate pricing audit is required.
Pre-close, request a full international pricing schedule and confirm which accounts have contractually agreed discount terms versus informal arrangements.
14.5.3 Price Trend Over Time — International Segment
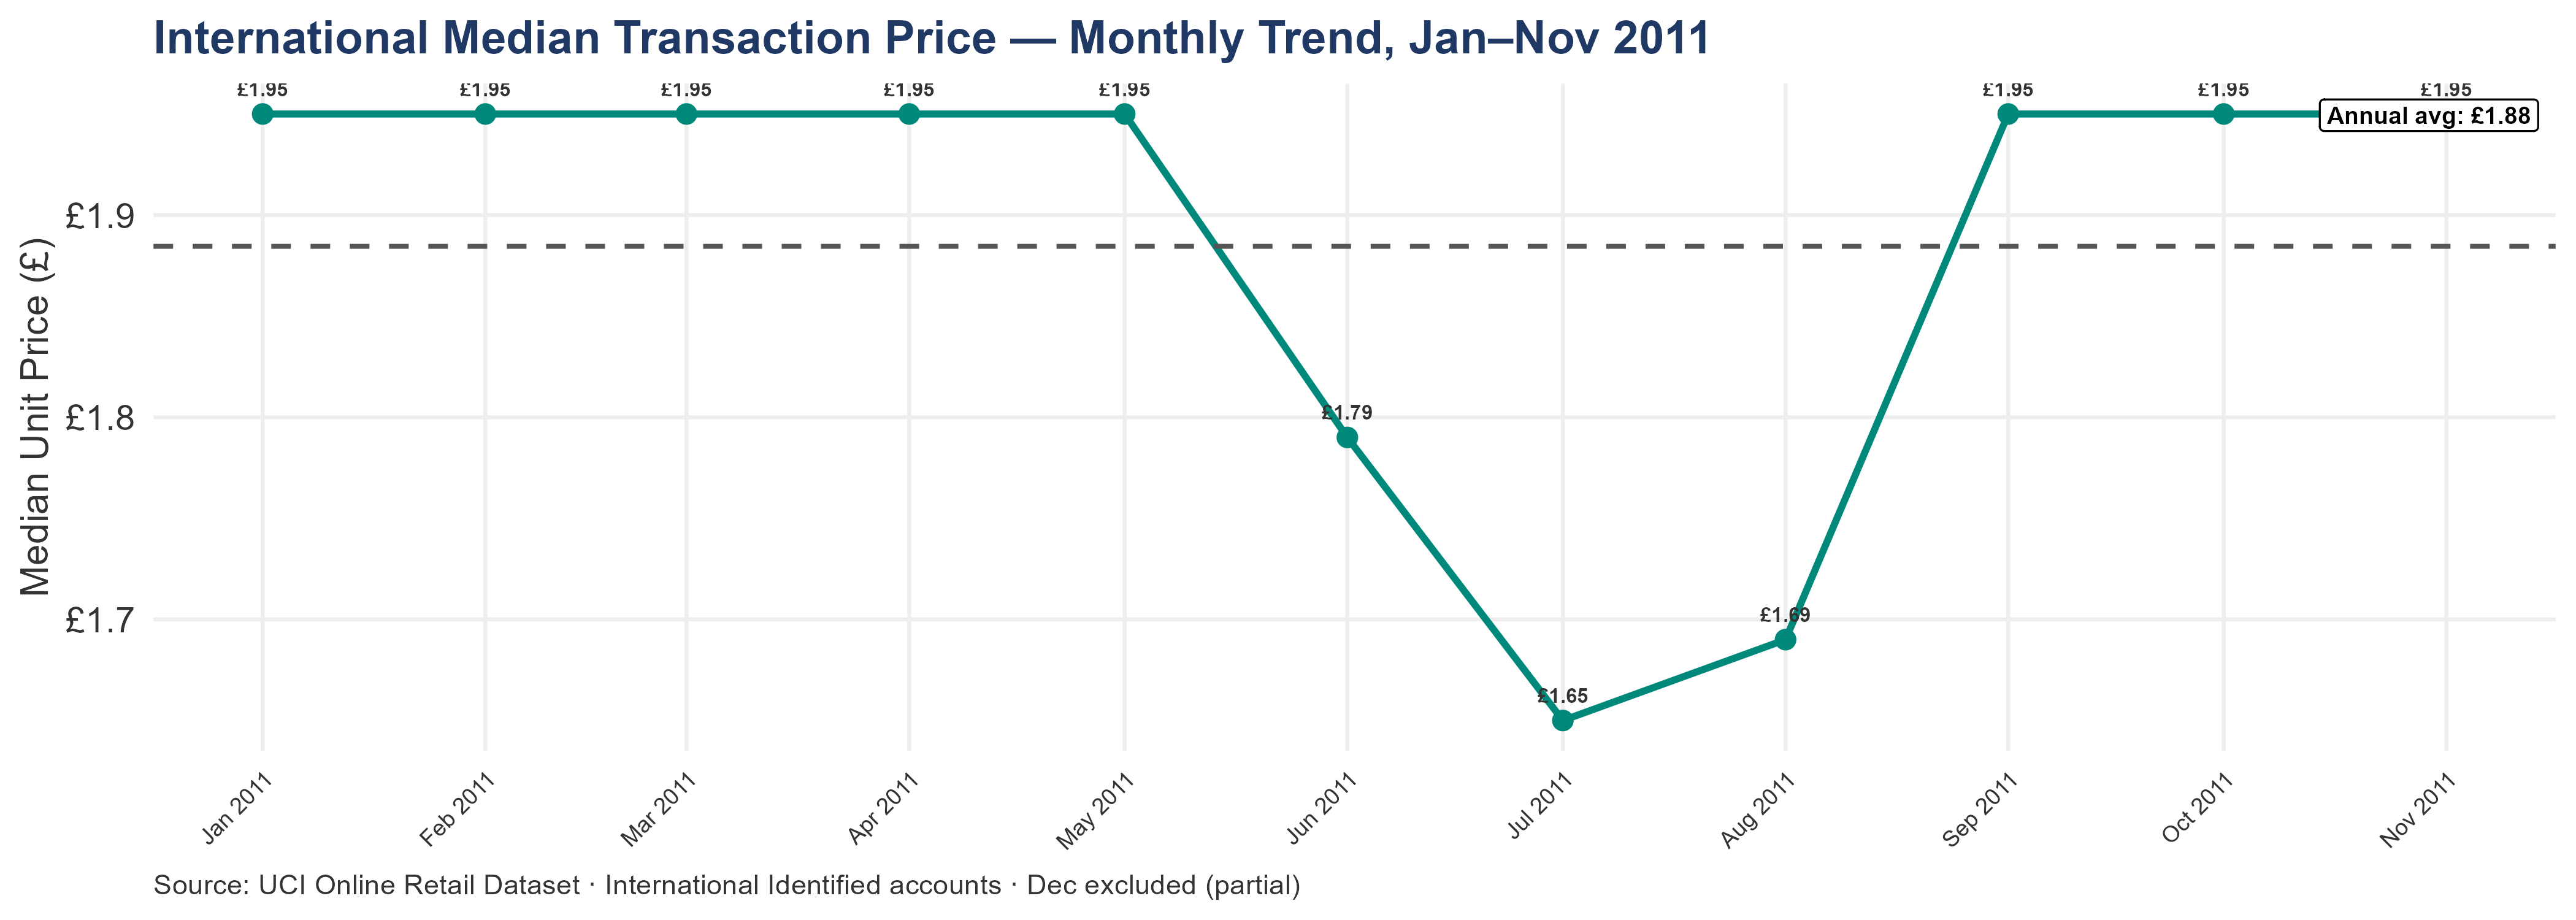
Monthly median unit price across the international top-10 products shows whether pricing has been stable, drifting, or subject to discrete shifts during the analysis period.
14.5.4 H1 vs H2 Price CV Trend
Products where H2 CV exceeds H1 by more than 3 percentage points are worsening and should be escalated to audit regardless of absolute level.
| Product | H1 CV | H2 CV | H1 Txns | H2 Txns |
|---|---|---|---|---|
| Rabbit Night Light | 7.1% | 7.4% | 47 | 110 |
| Dolly Girl Lunch Box | 6.8% | 6.5% | 76 | 73 |
| Set Of 3 Regency Cake Tins | 6.9% | 6.4% | 20 | 124 |
| Regency Cakestand 3 Tier | 6.5% | 6.1% | 115 | 179 |
| Spaceboy Lunch Box | 6.6% | 5.9% | 100 | 98 |
| Pink 3 Piece Polkadot Cut… | 5.8% | 4.9% | 34 | 57 |
| Round Snack Boxes Set Of4… | 5% | 4.6% | 122 | 178 |
| Round Snack Boxes Set Of … | 4.4% | 4.2% | 95 | 89 |
| Red Toadstool Led Night L… | 3.9% | 3.3% | 70 | 116 |
| Plasters In Tin Woodland … | 4% | 2.6% | 86 | 126 |
14.5.5 Currency Risk for International Pricing
Every international transaction in this dataset is denominated in pounds sterling. The customer’s local purchasing power — what the same goods cost in their home currency — is invisible in the data but directly affects their buying decisions. A price that was competitive in euros in January may not be competitive in November if the pound has strengthened against the euro over that period. This is a structural risk inherent to GBP-denominated international selling. It cannot be eliminated, but it should be understood when interpreting international demand changes — and particularly when diagnosing the H1-to-H2 cancellation increase. A buyer who misattributes an exchange-rate-driven demand shift to a relationship failure will waste outreach effort and miss the pricing adjustment that would actually address the problem. Post-close, the buyer’s finance team should implement a quarterly review of GBP exchange rates against the currencies of the top five international markets, flagging any movement above 5% as a demand risk factor for the affected accounts.
Author: Shawn Phillips | Lailara LLC
← Revenue Concentration Risk | Anonymous Revenue & Data Quality Risk →