10 Lifetime Value & Forward Portfolio
10.1 Lifetime Value by Segment
The chain model (£1.24K UK, £1.59K International) is the recommended base case for acquisition financial modeling. It uses median AOV, median orders per customer, and the observed first-to-second retention rate — all verifiable from the transaction data.
International LTV exceeds UK LTV by roughly 28% per customer, driven by higher median order values at broadly comparable retention rates. The per-account investment ceiling for international relationship management is proportionally higher — the business can afford to spend more protecting each international account because each one is worth more.
The gap between UK and international cumulative LTV widens each year. By year three, the per-customer premium of an international account over a UK account is larger in absolute terms than at year one. The compounding cost of losing an international customer strengthens the case for early, intensive retention intervention on that segment.
10.1.1 Whole-Business — Forward LTV by Segment
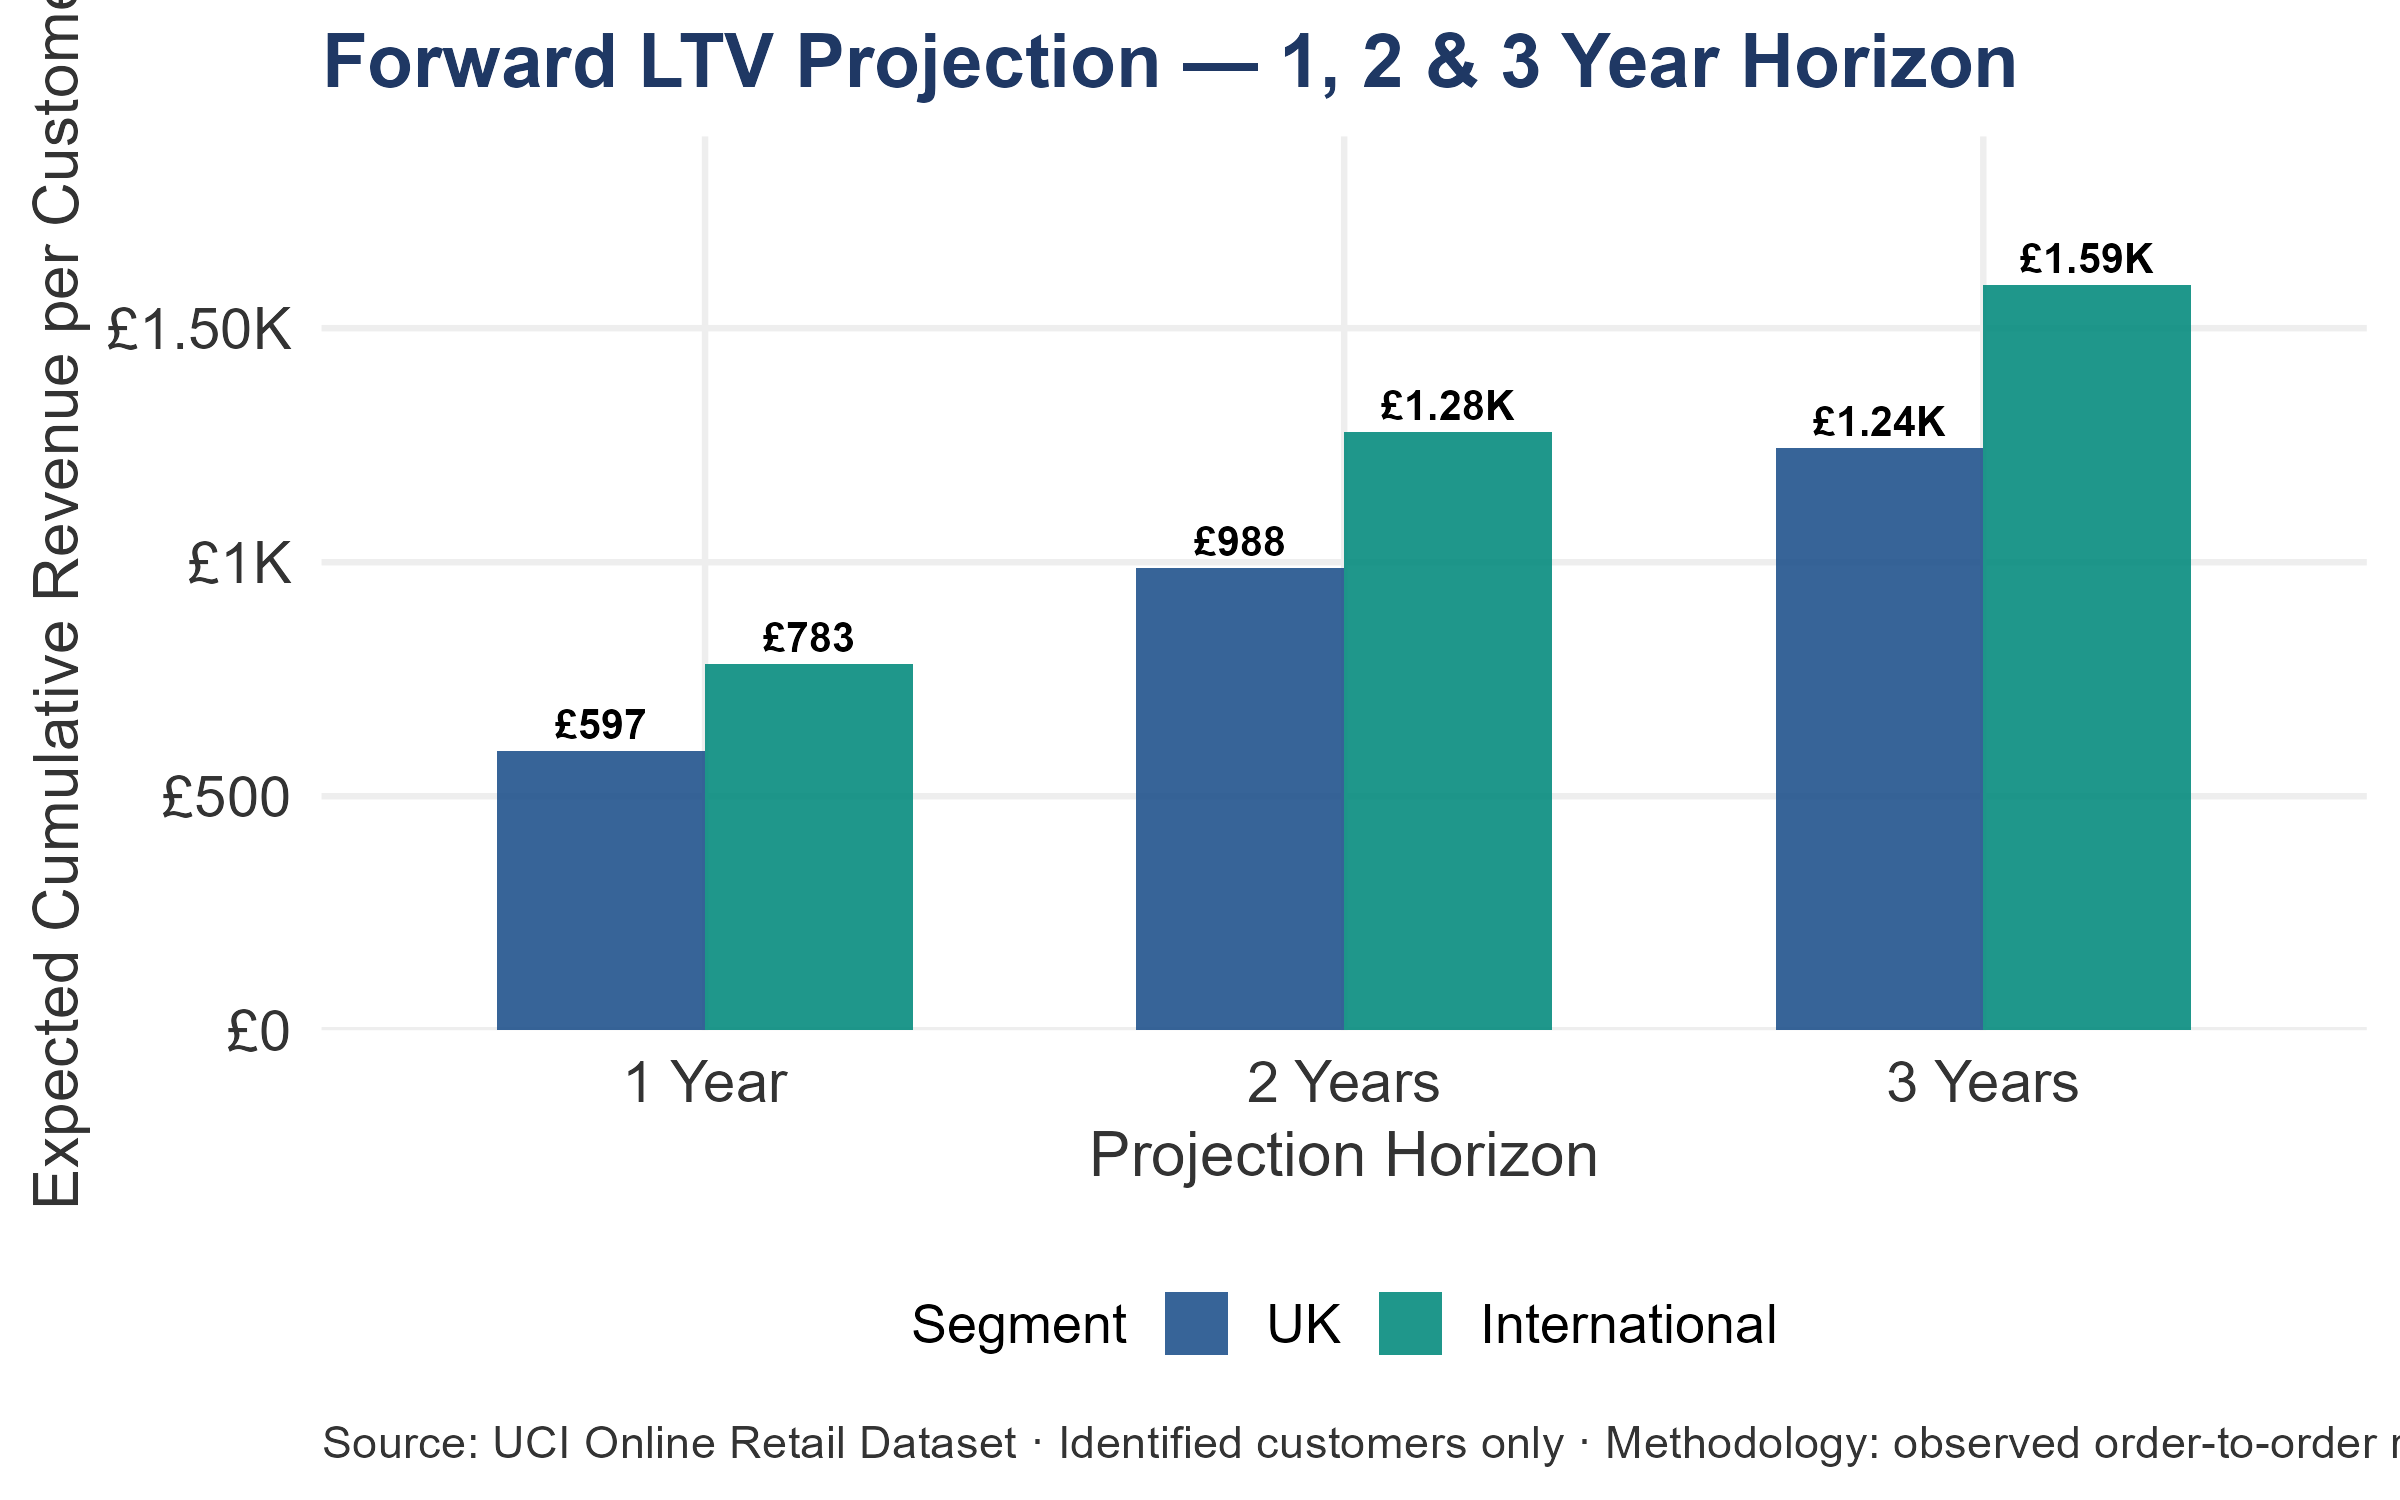
Per-customer LTV by segment shows how value accumulates over one, two, and three years — and where the gap between segments widens.
At observed performance, a UK customer is worth £1.24K over 3 years; an international customer £1.59K. Multiplied by the current customer count, these per-customer figures translate into the total revenue at stake from the existing base.
International customers generate 28% more 3-year LTV per customer (£1.59K vs £1.24K), yet the UK portfolio total is 7.4× larger (£4.87M vs £658.86K) — 3,914 identified UK customers against 414 internationally. UK programs are evaluated against absolute revenue scale; international programs against per-customer LTV. Both segments require dedicated programs because the same intervention carries different financial leverage in each.
The combined identified-segment 3-year forward portfolio of £5.53M is the revenue a competent acquirer is buying access to. This is not historical revenue — it is the projected forward value of the existing base at current retention rates. A DCF model built on this figure rather than trailing revenue captures the compounding consequence of retention decisions.
| Segment | Customer Count | Total 1-Yr Revenue | Total 2-Yr Revenue | Total 3-Yr Revenue |
|---|---|---|---|---|
| UK | 3,914 | £2.34M | £3.87M | £4.87M |
| International | 414 | £324.03K | £529.09K | £658.86K |
10.1.2 UK — Forward LTV per Customer
A new UK customer acquired today is expected to generate £597 in Year 1, £988 by the end of Year 2, and £1.24K over 3 years — based on observed retention rates and median order values. The gap between Year 1 and Year 3 is the forward value created entirely by the customer staying in the relationship. That gap — £647 — is what every retention program is trying to capture.
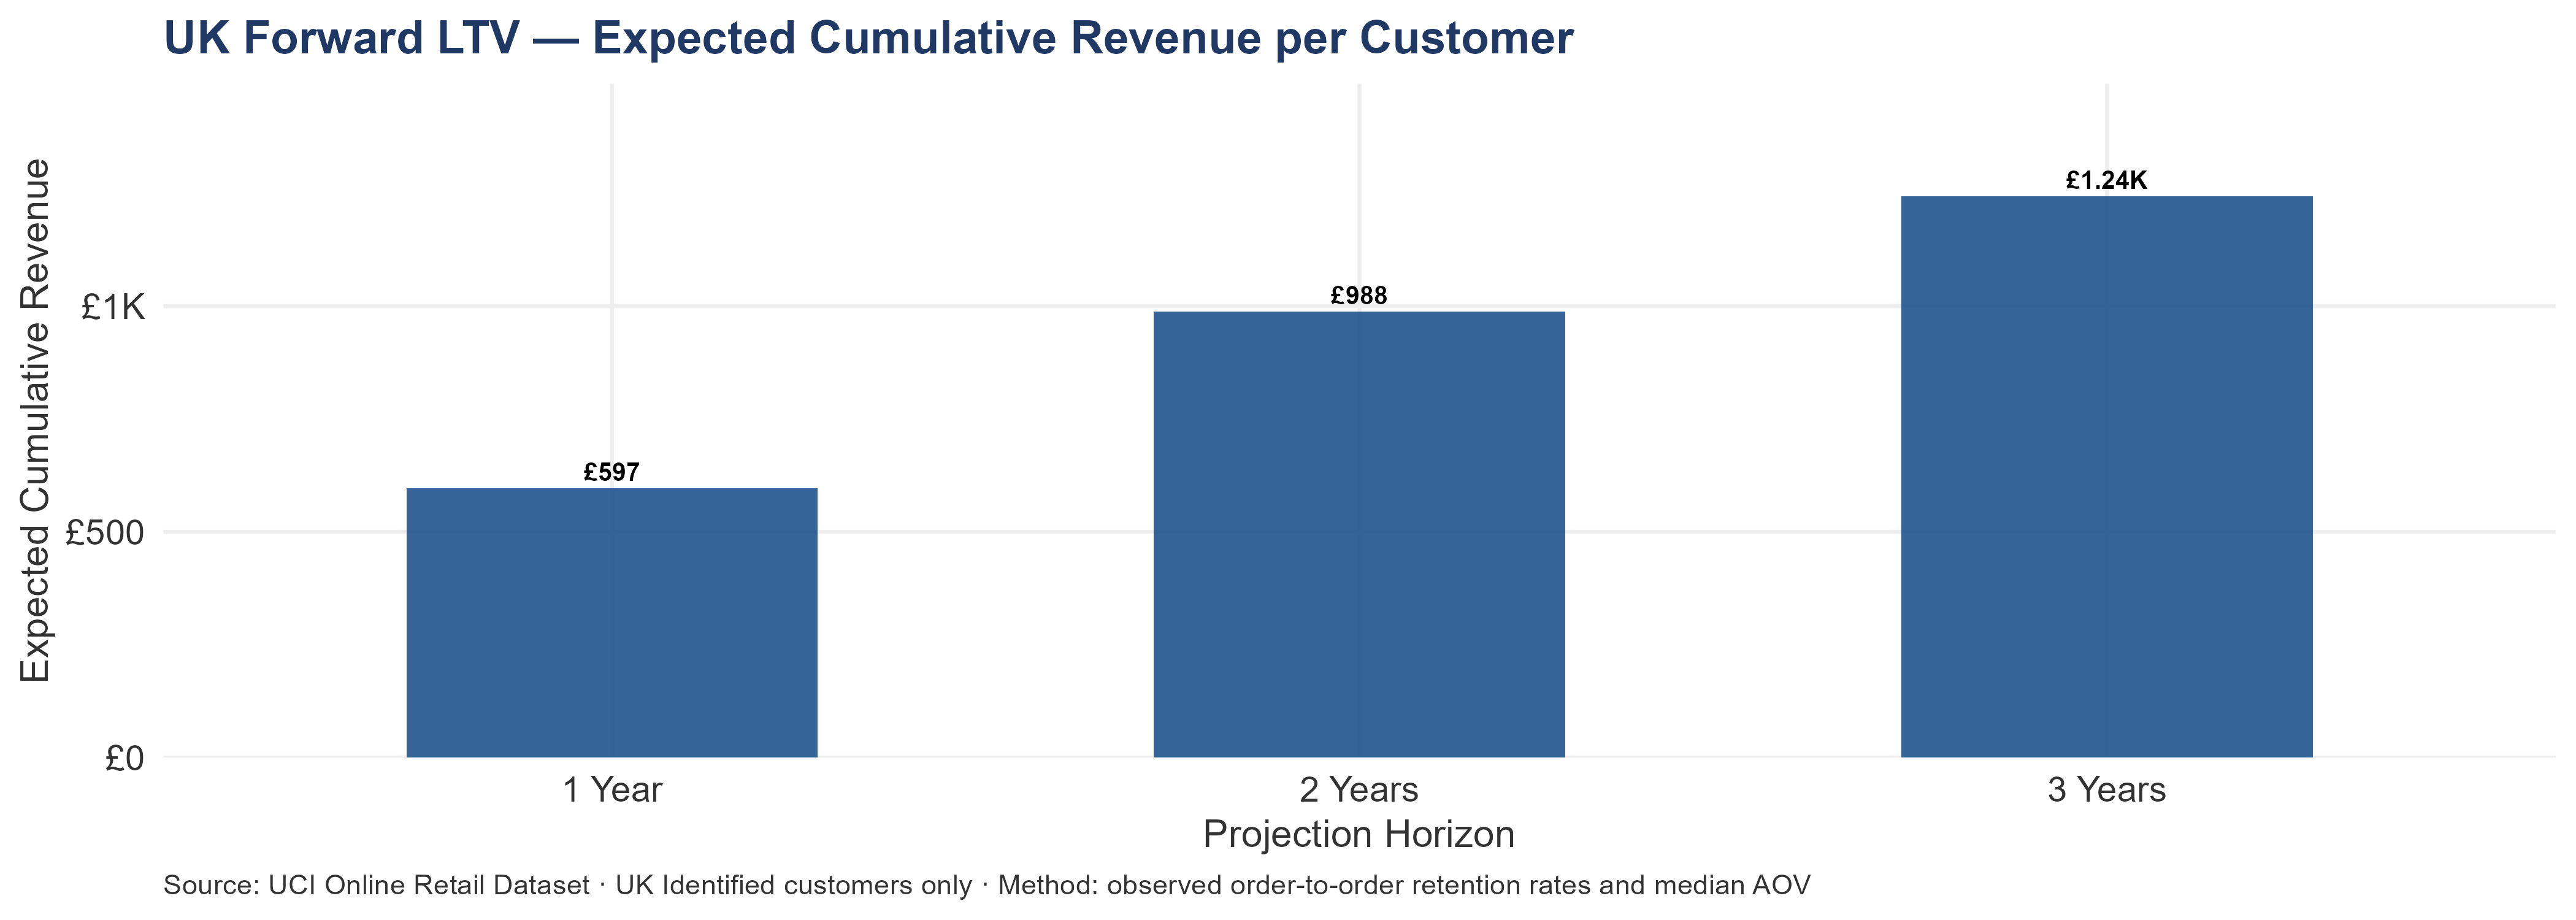
The UK LTV figure sets the investment ceiling for every post-close commercial decision. At £1.24K 3-year LTV, the defensible UK customer acquisition cost at a 3:1 LTV:CAC ratio is £415. Any UK-directed marketing or sales spend above this ceiling per new account acquired is eroding value at observed retention rates.
| Segment | Customer Count | Median AOV | Median Reorder (days) | 1->2 Retention | Steady Retention | LTV - 1 Year | LTV - 2 Years | LTV - 3 Years |
|---|---|---|---|---|---|---|---|---|
| UK | 3,914 | £299 | 52 | 65.46% | 74.04% | £597 | £988 | £1.24K |
Model inputs:
- Median AOV (£299) — the typical UK order size. This is the per-order revenue the model compounds through the retention chain.
- Median Reorder (52 days) — how often a UK customer returns at the median.
- 1→2 Retention (65.46%) — the share of first-time UK customers who place a second order. The single most commercially consequential input in the model.
- Steady Retention (74.04%) — the order-to-order return probability for established UK customers (order 5 and beyond).
10.1.3 International — Forward LTV per Account
International per-account LTV follows the same structure as UK but at higher absolute values, reflecting the segment’s stronger median AOV and comparable retention rates.

A new international account acquired today is expected to generate £783 in Year 1, £1.28K by the end of Year 2, and £1.59K over 3 years. The gap between Year 1 and Year 3 — £809 — is the forward value created entirely by the account staying in the relationship.
The international 3-year LTV of £1.59K is 28% higher than the UK figure of £1.24K. This reflects the international segment’s higher median AOV of £391 vs £299 for UK. Each international account retained is worth more per relationship than a UK account. This is why the international segment’s per-account retention programs have a higher payoff than equivalent UK programs — even though the UK portfolio total is larger.
| Segment | Account Count | Median AOV | Median Reorder (days) | 1->2 Retention | Steady Retention | LTV - 1 Year | LTV - 2 Years | LTV - 3 Years |
|---|---|---|---|---|---|---|---|---|
| International | 414 | £391 | 52 | 63.29% | 69.29% | £783 | £1.28K | £1.59K |
Projected revenue per account — annual increments:
| Year | Revenue per Account | Portfolio Total |
|---|---|---|
| Year 1 | £783 | £324.03K |
| Year 2 (incremental) | £495 | £205.06K |
| Year 3 (incremental) | £313 | £129.77K |
| 3-Year Total | £1.59K | £658.86K |
Model inputs:
- Median AOV (£391) — the typical international order size. This is 1.3x the UK median.
- Median Reorder (52 days) — how often an international account returns. Longer than UK due to cross-border logistics and ordering cycles.
- 1→2 Retention (63.29%) — the share of first-time international accounts that place a second order. The single most consequential input in the model.
- Steady Retention (69.29%) — order-to-order return probability for established accounts (order 5+).
10.1.4 UK vs International — How Each Segment Builds Cumulative LTV
The cumulative LTV comparison confirms that the gap between segments widens over time. By year three, the international per-customer value premium over UK is larger in absolute terms than at year one. This means the cost of losing an international customer compounds faster than the cost of losing a UK customer — and strengthens the case for earlier, more intensive intervention on international account retention.
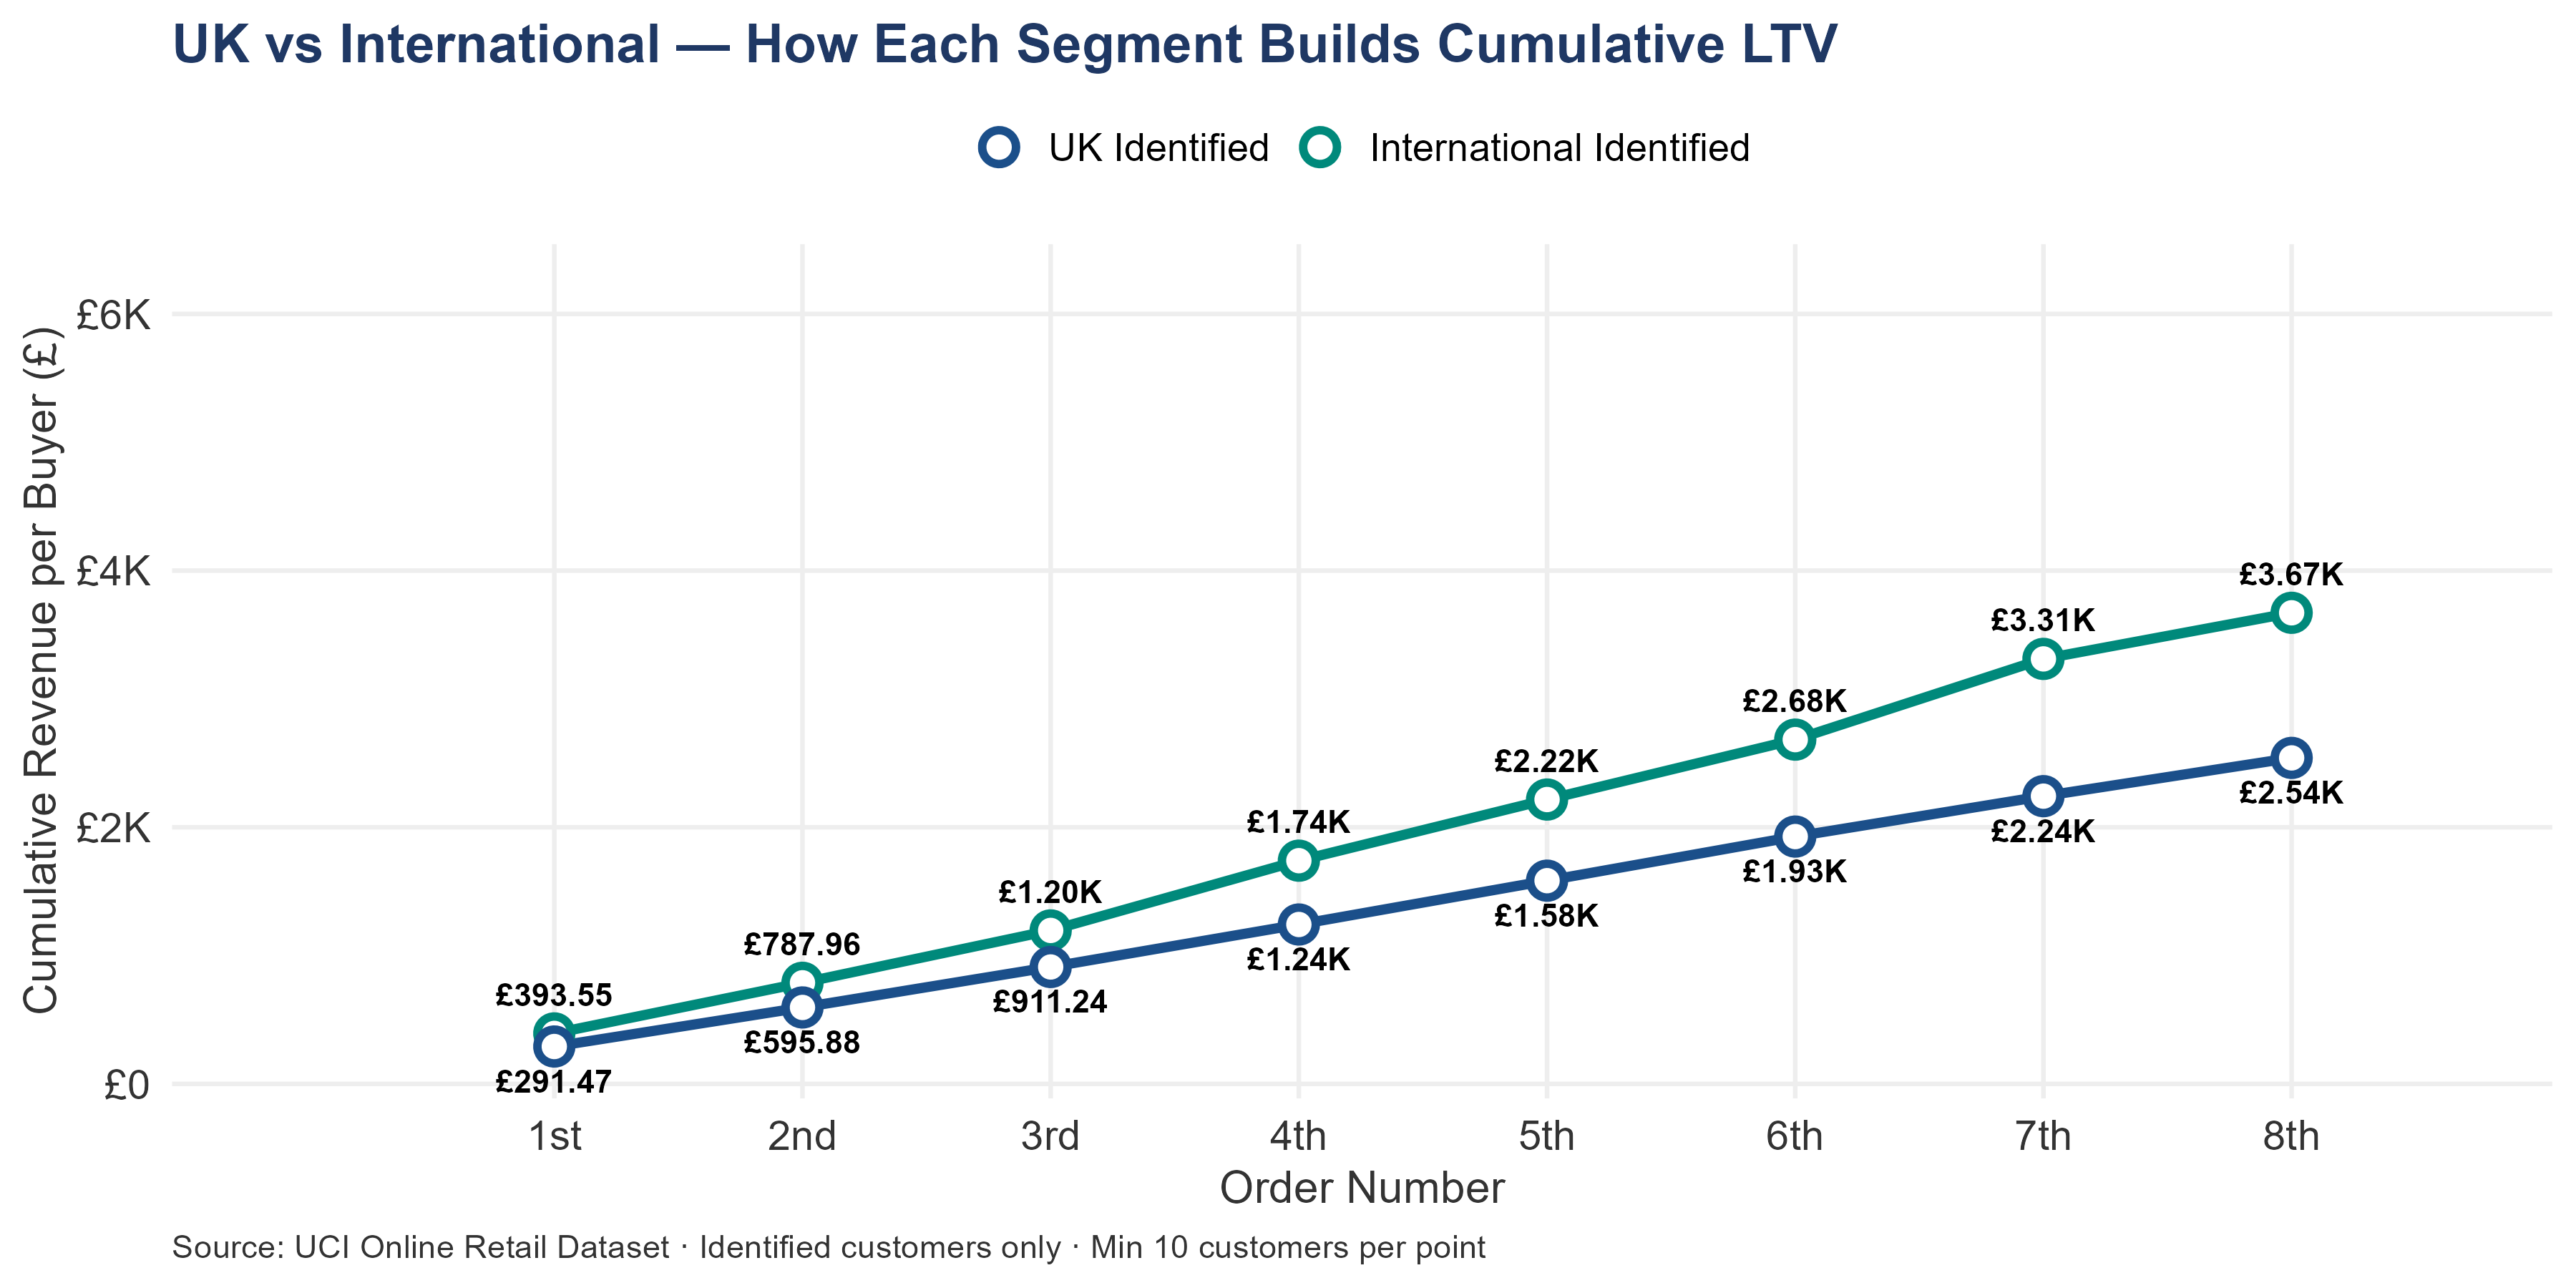
International customers generate higher cumulative revenue per customer at every order — from order 1 (£394 vs £291 for UK) through order 8 (£3.67K vs £2.54K for UK). By the 8th order, an international customer has generated 45% more cumulative revenue than a UK customer. This is an observed historical figure — it describes customers who actually placed 8 orders, so it is higher than the forward LTV projection for a newly acquired customer (which accounts for the probability of churn at each order step). This has a direct implication for acquisition investment: the business can invest proportionally more to acquire an international identified customer and still achieve the same ROI as a UK acquisition.
The international acquisition CAC ceiling should be reset based on the observed cumulative revenue per international customer.
10.2 Forward Portfolio Value — What the Existing Base Is Worth
The forward portfolio value represents what the current customer base will generate over the next three years if nothing changes — if current retention rates, ordering frequencies, and order values persist.
The forward portfolio represents what the current customer base will generate at observed rates — not a whole-business revenue forecast. It excludes new acquisition. The question it answers is narrower and more useful: what are the customers the business already has worth going forward?
The combined three-year forward portfolio is £5.53M. This is the starting point for any DCF model built on customer-level economics. Any program that improves retention or frequency pushes this number up. Any disruption — including the uncertainty of an ownership transition — pushes it down.
10.2.1 Combined Portfolio — UK + International
The combined forward portfolio aggregates both segments into the single figure an acquirer uses as the starting point for customer-level DCF modeling.
This £5.53M three-year total represents what the existing, identified customer base is projected to generate at current retention rates and ordering frequencies — it does not include new acquisition, anonymous revenue, or any program improvements. The figure is conservative by construction: it excludes £1.51M in annual anonymous revenue that cannot be modeled without identity resolution, and it uses the chain model’s observed retention rates rather than optimistic steady-state assumptions. For a buyer, this number answers a specific question: what is the business already generating from relationships it can manage? Every program that improves retention pushes this number up. Every disruption — including the uncertainty inherent in an ownership transition — pushes it down.
| Segment | Customer Count | Total 1-Yr Revenue | Total 2-Yr Revenue | Total 3-Yr Revenue |
|---|---|---|---|---|
| UK Identified | 3,914 | £2.34M | £3.87M | £4.87M |
| International Identified | 414 | £324.03K | £529.09K | £658.86K |
| Combined | 4,328 | £2.66M | £4.40M | £5.53M |
10.2.2 UK — Total Forward Revenue at Stake
UK portfolio context. The 3,914 UK customers represent £4.87M in three-year forward value. This is the revenue at stake from the existing base — not what new acquisition might add, but what the business already has if it retains these customers at historical rates.
| Segment | Customer Count | Total 1-Yr Revenue | Total 2-Yr Revenue | Total 3-Yr Revenue |
|---|---|---|---|---|
| UK Identified | 3,914 | £2.34M | £3.87M | £4.87M |
The UK portfolio in context: The 3,914 UK Identified customers represent £4.87M in total 3-year forward portfolio value at observed behavior. This is the revenue at stake from the existing base — not acquisition projections, but the forward value of customers the business already has if it retains them at historical rates.
International customers generate 28% more per customer over 3 years than UK customers (£1.59K vs £1.24K). Yet the UK portfolio total (£4.87M) is significantly larger than the international total (£658.86K) — because the UK has 3,914 identified customers versus only 414 internationally. UK programs that improve retention at scale therefore move larger absolute numbers.
10.2.3 International — Total Forward Revenue at Stake
International portfolio context. The 414 international accounts represent £658.86K in three-year forward value. The per-account forward value is higher than UK (£1.59K vs £1.24K), but the UK total is much larger because it has nearly ten times as many accounts. UK programs that improve retention at scale move larger absolute numbers. International programs that retain individual high-value accounts produce a higher return per account. Both are valid responses to different parts of the same data.
| Row | Account Count | Year 1 Total | Year 2 Total | Year 3 Total |
|---|---|---|---|---|
| International Portfolio | 414 | £324.03K | £529.09K | £658.86K |
| Year 1 revenue | £324.03K | |||
| Year 2 additional revenue | £205.06K | |||
| Year 3 additional revenue | £129.77K |
The international portfolio in context: The 414 international identified accounts represent £658.86K in total 3-year forward portfolio value at observed behavior. The UK portfolio total is £4.87M — larger in absolute terms because the UK has 3,914 accounts versus 414 internationally.
The investment implication: UK programs that improve retention at scale move larger absolute numbers. International programs that retain or acquire high-LTV accounts produce a higher return per account. Both are correct responses to different parts of the same data. The international segment is where per-account investment has the highest payoff; the UK segment is where scale-based programs have the largest absolute impact.
Author: Shawn Phillips | Lailara LLC
← Lifetime Value Model — Methodology | Retention Cost & Program Scenarios →