5 International Customer Landscape
5.1 High Value, High Stakes
The international segment is smaller than the UK by every measure except one: per-account economics. International customers spend more per order, generate higher lifetime value, and represent more revenue per account than UK customers.
The segment is also where the most concentrated risk sits. Four accounts generate 44.33% of international net revenue. The transaction data shows no evidence of named relationship management for any of them. During an ownership transition — precisely when these relationships are most vulnerable — this concentration creates significant exposure.
Warning
Four accounts generate 44.33% of international revenue
Accounts 14646, 14911, 12415, and 14156 account for £649.65K of £1.47M in international net revenue. The transaction record shows no evidence of dedicated relationship management for any of them.
The International Identified segment comprises every named account placing orders from outside the United Kingdom. These 414 accounts generated £1.50M in gross revenue — 14.57% of the total — across 1,818 orders.
International accounts operate at materially different economics from the UK segment. The median AOV is £391, roughly 1.3 times the UK figure of £299. Per-account revenue is higher, but so is concentration: the top 4 accounts generate 44.33% of all international revenue. No other segment carries that level of account-level exposure. A single relationship failure here removes a double-digit share of international revenue.
Those four accounts — 14646, 14911, 12415, and 14156 — combine for £649.65K in net revenue, with 14646 alone at £278.78K (19.02% of the segment). The transaction record shows no named relationship owners for any of them. Ownership transition is the moment these relationships are most vulnerable: an announcement without named contacts already in place gives each account a reason to reconsider its supplier at the precise moment it has the least information about what comes next. Named assignment at close — not within 30 days, at close — is Condition 2 of the acquisition.
The per-account economics have a direct investment implication. At 14.57% of identified revenue from 9.57% of identified accounts, each international relationship is worth proportionally more. The LTV:CAC analysis later in the book shows the acquirer can spend more to acquire and retain an international account and still achieve equivalent ROI. A strategic buyer with existing international distribution infrastructure holds an advantage — the cost of serving these accounts may be lower for them than for a standalone UK operator, while revenue per account stays the same.
Before Q4, 72 international accounts went silent in H2, carrying combined H1 revenue of £52.63K. Outreach from new ownership serves a dual purpose: reactivation and introduction. Accounts that lapsed under prior management may respond differently to a new owner. At this segment’s per-account revenue, reactivating even a handful produces a meaningful absolute return at zero acquisition cost.
Revenue spans 35 markets, but within-market concentration is extreme — several markets depend on a single account. The Netherlands leads at 18.96% of international revenue. Markets where one account generates 100% of market revenue are not markets in any commercial sense; they are individual relationships that happen to be domiciled abroad. Whether those relationships are tied to the current ownership team or to the business itself determines whether they survive the transition. The market breakdown in The Geographic Picture identifies which markets carry this risk.
International accounts concentrate their spend across 586 SKUs — a different catalog from the UK segment’s top sellers. Products in the UK top 10 but absent from the international top 10 are UK products, not international ones. Any cross-sell or catalog expansion strategy for this segment must be built from international purchasing patterns, not from UK preferences applied internationally.
5.2 The International Profile
| Metric | International | UK Identified |
|---|---|---|
| Total Accounts | 414 | 3,914 |
| Gross Revenue | £1.50M | £7.00M |
| Net Revenue | £1.47M | £6.80M |
| Median Account Revenue | £944 | £644 |
| Mean Account Revenue | £3.62K | £1.79K |
| Median Order Value (AOV) | £391 | £299 |
| Mean Order Value (AOV) | £823 | £422 |
| Total Orders | 1,818 | 16,576 |
The table above places UK and International segments side by side on the same metrics. Where international figures are higher per account — median revenue, AOV, LTV — they confirm the premium economics. Where UK figures are higher in aggregate — total revenue, total accounts — they confirm the volume advantage. An acquirer needs both: UK for scale, international for per-account return.
The International Identified segment comprises 414 named wholesale accounts ordering from outside the United Kingdom. Together they generated £1.50M in gross revenue across 1,818 orders during the analysis period. Net revenue after cancellations is lower; the specific accounts driving that gap are identified later in the book.
The segment’s commercial weight comes from depth rather than breadth. The UK segment derives its scale from 3,914 accounts spread across many relationships. The international segment derives its value from a smaller number of accounts placing larger orders — median AOV of £391 against £299 for the UK, or 1.3x per order at the median. Each international order reversal therefore carries a proportionally larger absolute revenue impact. The segment cancellation rate is 2.09% of gross revenue.
The median international account generated £944 in gross revenue across the period. The mean is £3.62K — 3.8x the median. That ratio is wider than the UK segment’s mean-to-median gap, indicating more severe top-account concentration. A small number of high-revenue accounts pull the average well above what a typical international customer generates. The median is the correct benchmark for typical-account planning; individual account records are the correct reference for top-account management.
Revenue grew from £624.52K in H1 to £872.40K in H2, a 39.69% increase half-on-half. Active accounts rose from 262 in H1 to 342 in H2. Q4 seasonality contributes to the H2 increase, but the direction is a leading indicator for Q1 2012 performance.
International accounts represent 9.57% of identified customers but generate 14.57% of total business revenue. That disproportionate contribution is the arithmetic consequence of higher per-account value. Growing the international account base or improving retention of existing international accounts delivers a higher revenue return per relationship than equivalent effort in the UK segment.
The four commercial relationships in this segment:
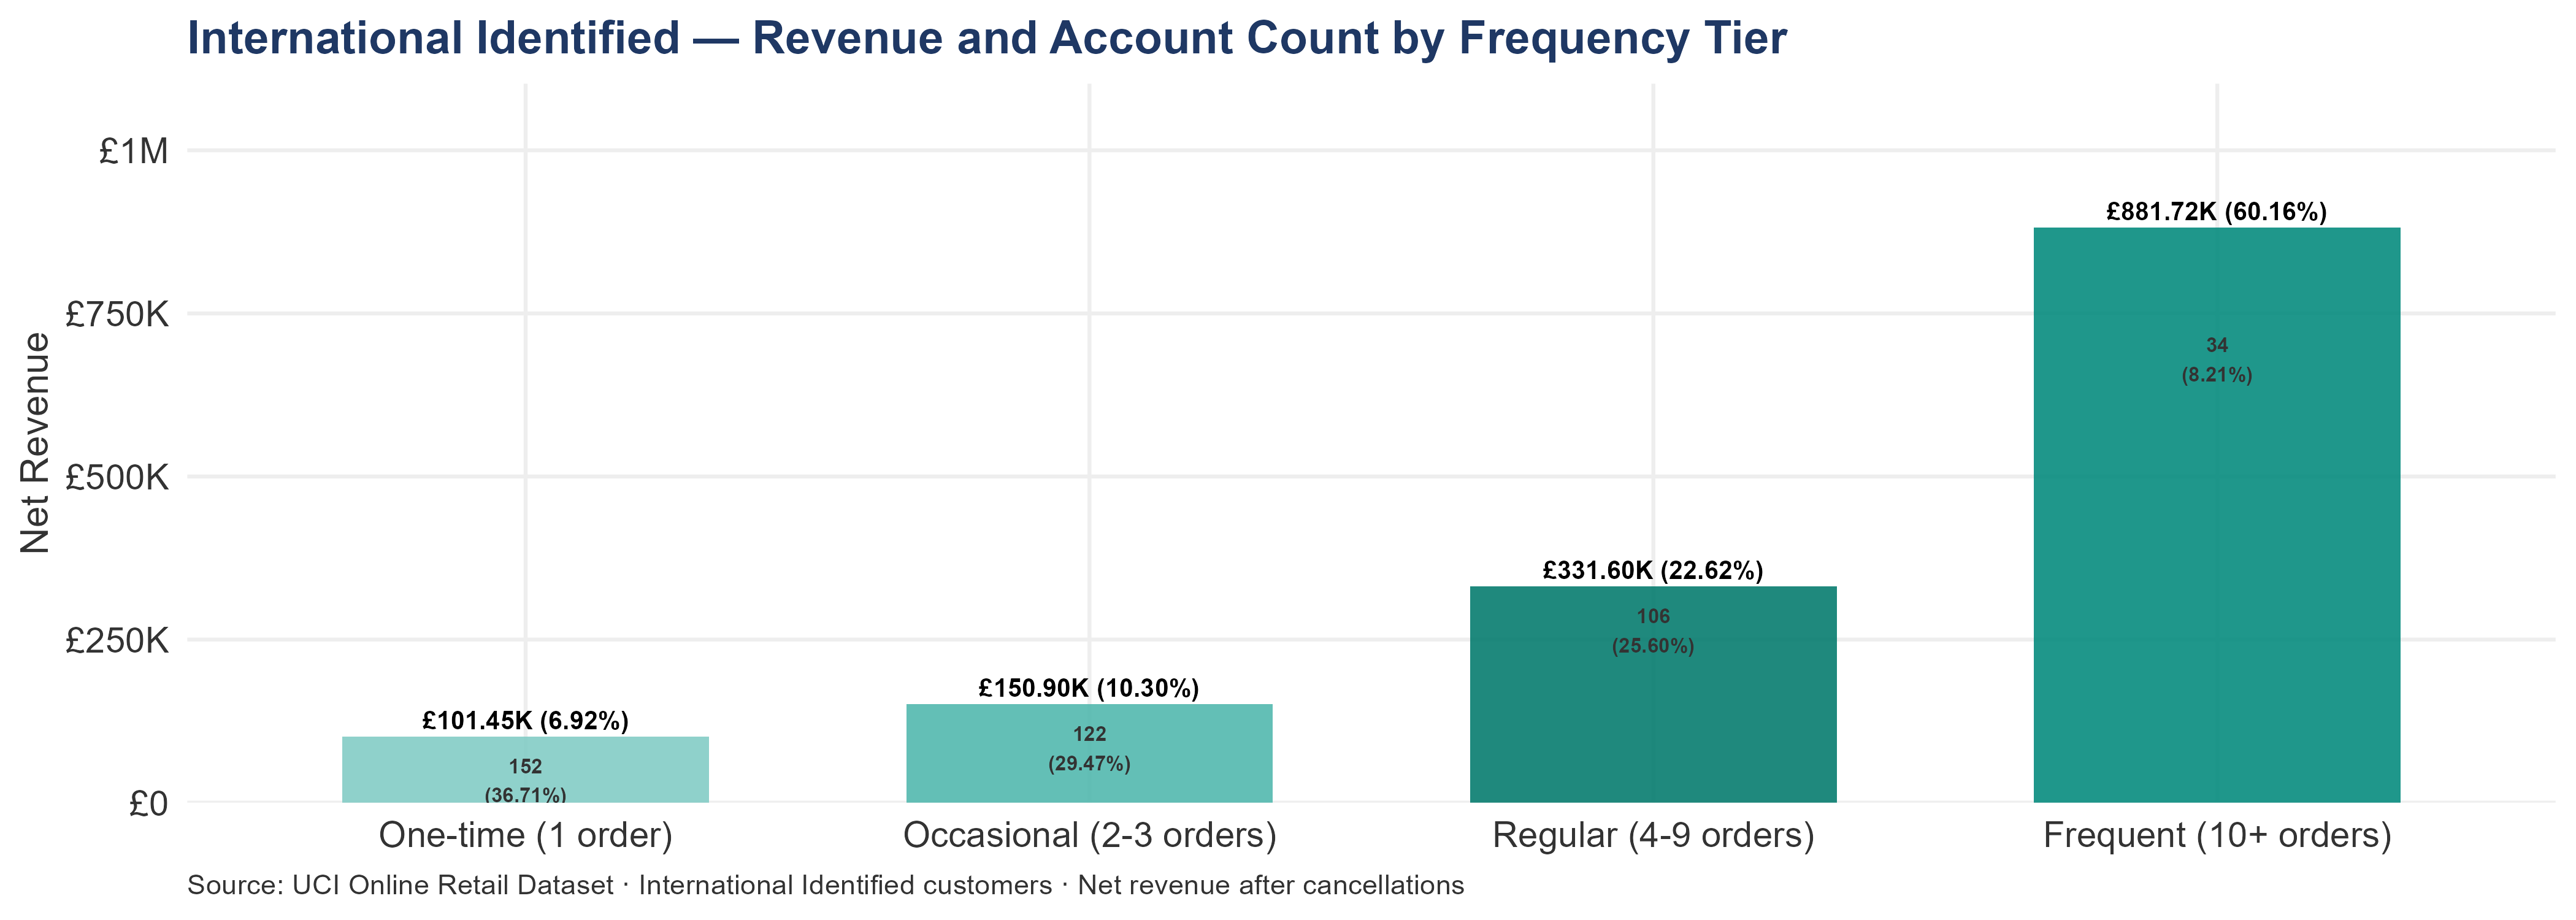
One-time accounts (152 accounts, 36.71% of the segment) placed exactly one international order and have not returned. The UK segment’s one-time rate is 34.54% — nearly identical. The rates are not the commercial story. The commercial story is what happens after the second order: international accounts that become Occasional or Regular customers generate median revenue of £832 and £2.35K respectively — multiples of a typical UK account at the same tier. The conversion window matters more here than in the UK segment precisely because the prize is larger. Among international accounts that did return for a second order, the median time from first to second order was 51 days — compared to 58 days for UK accounts. A structured follow-up contact within that window is the highest-ROI action available for one-time international accounts.
Occasional accounts (122 accounts, 2–3 orders) have returned at least once. Each represents a relationship that was satisfactory enough for a second transaction. In a segment where individual account revenue is high, an Occasional account moving to Regular is worth a structured investment in the relationship — not just a passive wait.
Regular accounts (106 accounts, 4–9 orders) are the segment’s working base. They order with enough frequency to be predictable and to flag when they go silent. These accounts have demonstrated commitment through repeated transactions and represent the pipeline to Frequent status.
Frequent accounts (34 accounts, 10+ orders) generate 60.16% of all International net revenue from 8.21% of the account base. These 34 accounts generating 60.16% of segment revenue — within an already-concentrated segment — represent the densest concentration the data shows. These are the segment’s irreplaceable accounts. The median Frequent international account has spent £6.34K — 17 times the median one-time account. Losing a single Frequent international account is not replaceable through acquisition at any reasonable cost.
| Tier | International | UK Identified |
|---|---|---|
| One-time (1 order) | 152 (36.71%) | 1,352 (34.54%) |
| Occasional (2-3 orders) | 122 (29.47%) | 1,206 (30.81%) |
| Regular (4-9 orders) | 106 (25.60%) | 1,003 (25.63%) |
| Frequent (10+ orders) | 34 (8.21%) | 353 (9.02%) |
| Median days to 2nd order | 51 days | 58 days |
| Tier | Accounts | % of Accounts | Total Net Revenue | % of Revenue | Median Revenue |
|---|---|---|---|---|---|
| One-time (1 order) | 152 | 36.71% | £101.45K | 6.92% | £364 |
| Occasional (2-3 orders) | 122 | 29.47% | £150.90K | 10.30% | £832 |
| Regular (4-9 orders) | 106 | 25.60% | £331.60K | 22.62% | £2.35K |
| Frequent (10+ orders) | 34 | 8.21% | £881.72K | 60.16% | £6.34K |
5.2.1 Account Acquisition by Quarter
When were international customers first acquired — and how does cohort vintage affect revenue?
| Acquisition Quarter | Accounts | Total Net Revenue | Median Revenue |
|---|---|---|---|
| Q4 2010 | 70 | £846.06K | £3.03K |
| Q1 2011 | 132 | £376.37K | £1.12K |
| Q2 2011 | 77 | £128.68K | £1.00K |
| Q3 2011 | 68 | £73.32K | £873 |
| Q4 2011 | 67 | £41.24K | £392 |
Accounts acquired in earlier quarters have had more time to build transaction history and demonstrate a reorder pattern. Accounts acquired in 2010 — particularly Q4 2010 — represent the oldest international relationships. Of the 70 international accounts first acquired in 2010, of whom 12 placed zero orders in 2011 — they are the lapsed accounts identified in Wallet & Momentum. These are not new prospects. They are established relationships that have gone cold and represent the lowest-cost reactivation opportunity in the segment.
The Q4 2010 cohort has a median revenue of £3.03K — compared to £392 for Q4 2011 accounts. That is an 8x difference in median account value between the oldest and newest cohorts. This is the acquisition argument: a new international account is not worth its first-order value — it is worth its full 12-month development trajectory. Accounts need approximately 12 months of active relationship management before they reach their typical revenue potential. Every new account acquired in Q4 2011 is at day 1 of that development window.
The business acquired 209 new accounts in H1 2011 and 152 in H2. Acquisition slowed in H2. If this trend continues into 2012, the account base will not grow fast enough to offset natural churn from lapsed and silent accounts.
Accounts first acquired in Q4 2011 — 67 accounts — have only a partial transaction history. They placed their first order in the final weeks of the analysis period. Whether they reorder will become clear in Q1 2012. These accounts should be in the day-30 follow-up queue now.
5.2.2 International Seasonality
Does the International segment follow the whole-business Q4 pattern, or does it have its own timing?
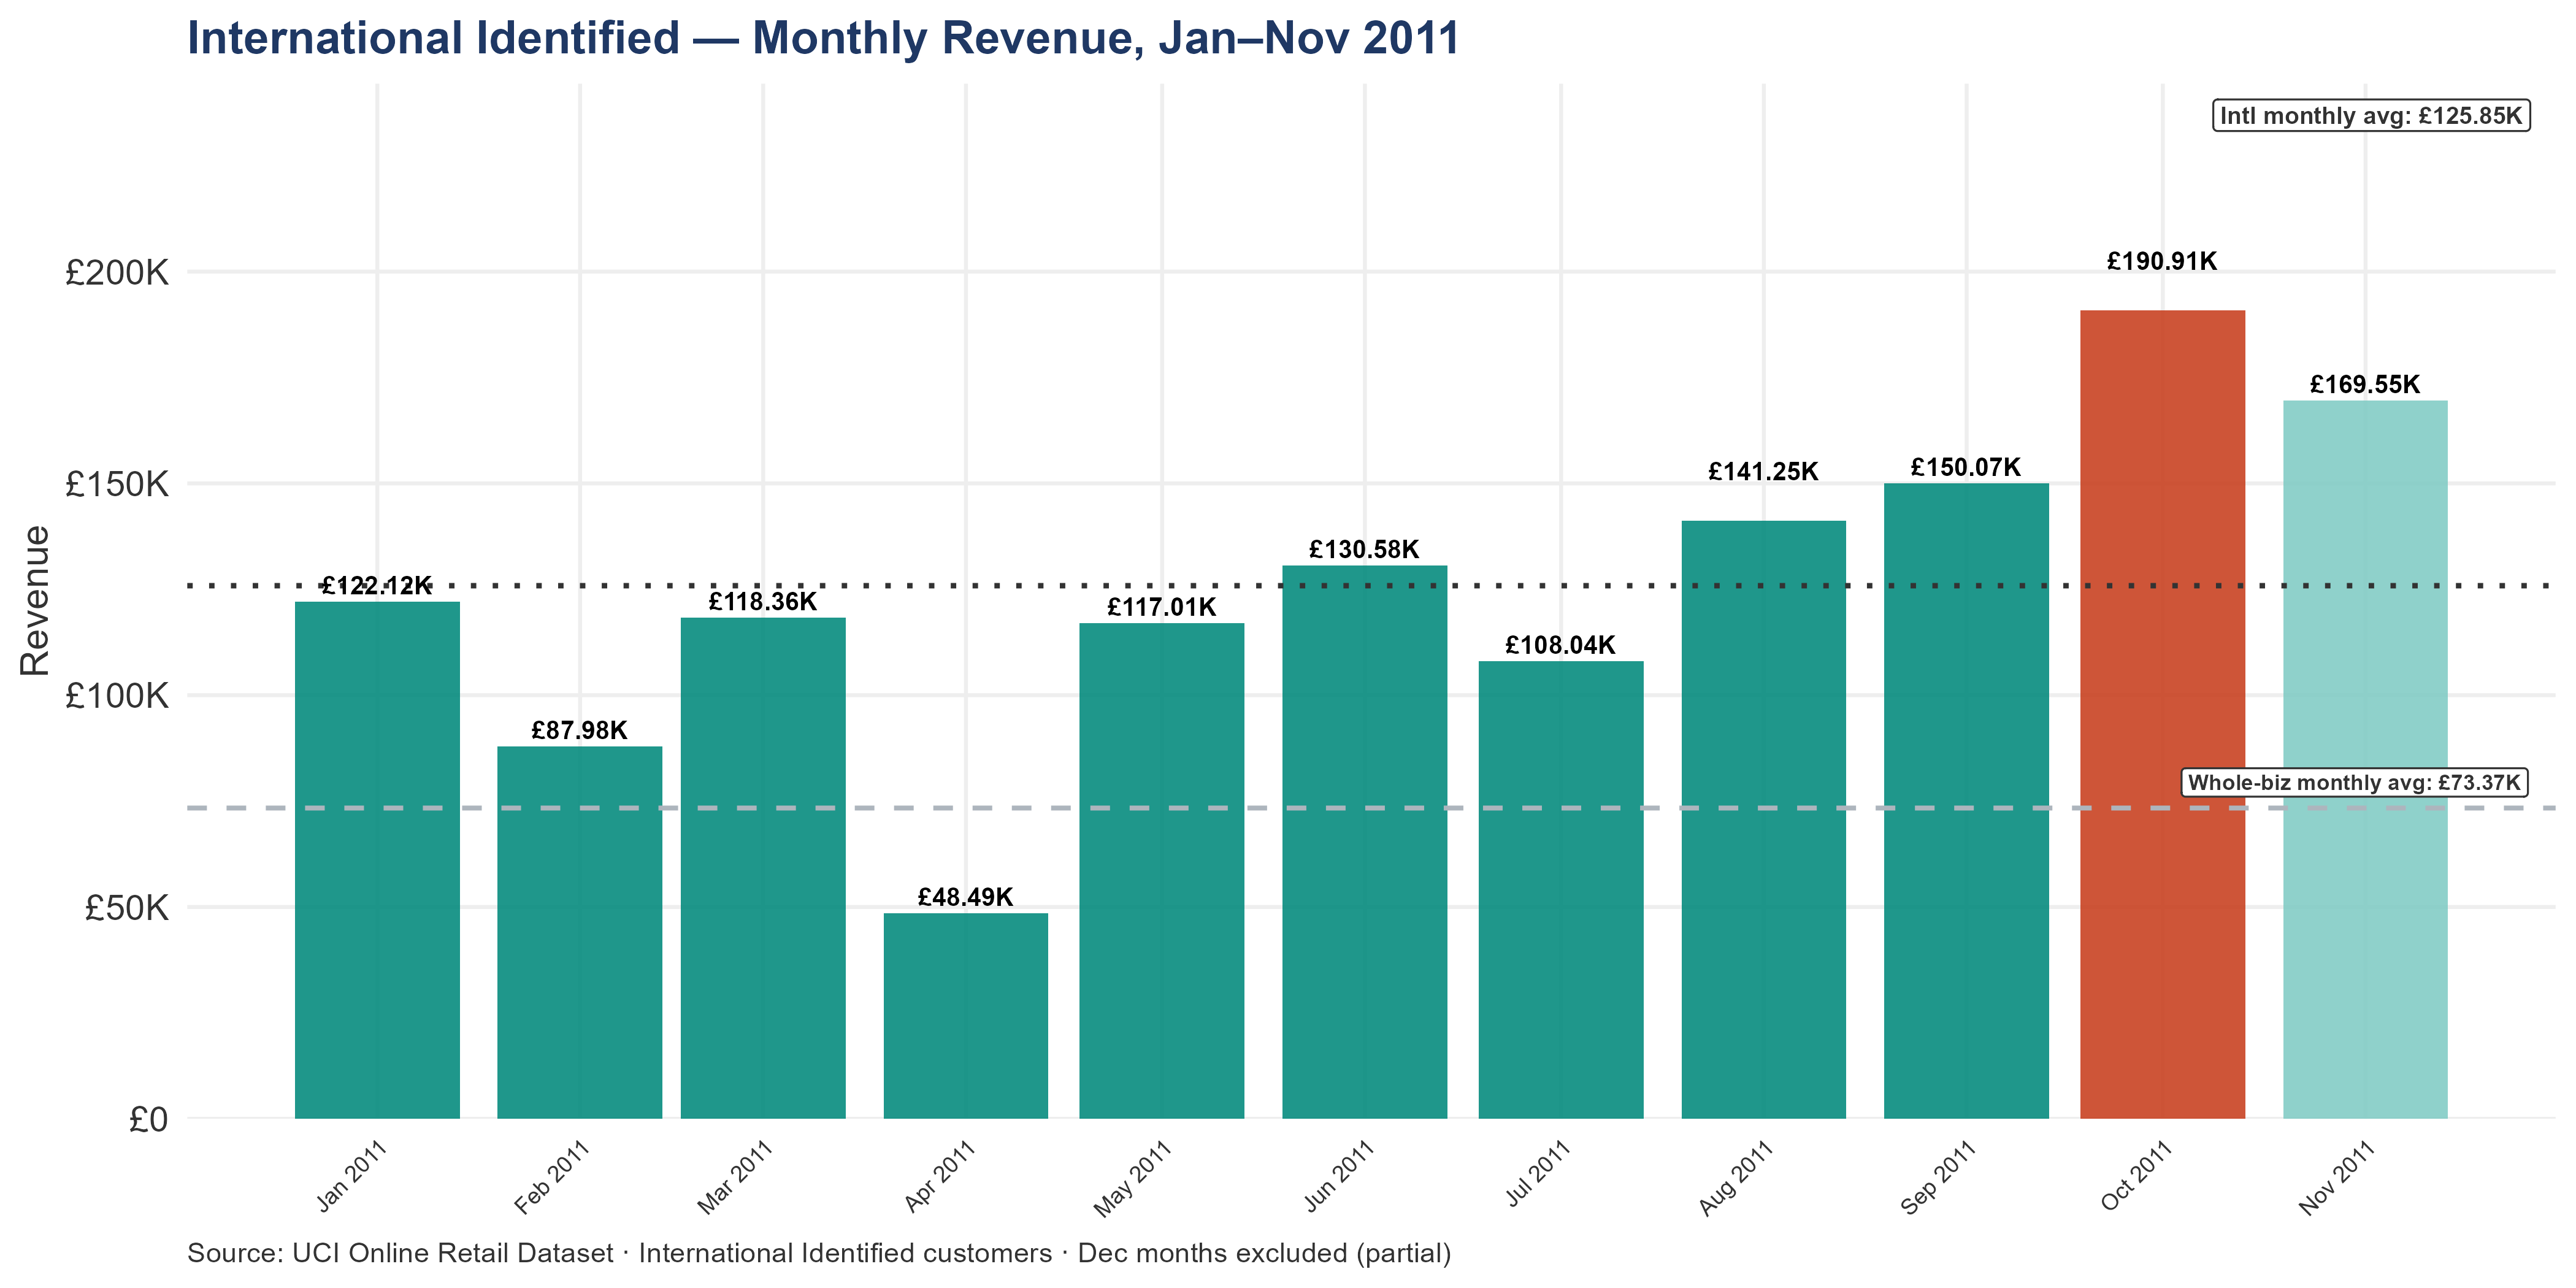
International Q4 accounts for 28.27% of annual International revenue — somewhat below the whole-business figure of approximately 33.49%. International accounts show a less pronounced seasonal spike than UK accounts. For an acquirer, this means deal timing is slightly less constrained for the international segment than for UK. International revenue peaked in October 2011 — £190.91K, representing 13.37% of annual International revenue in a single month.
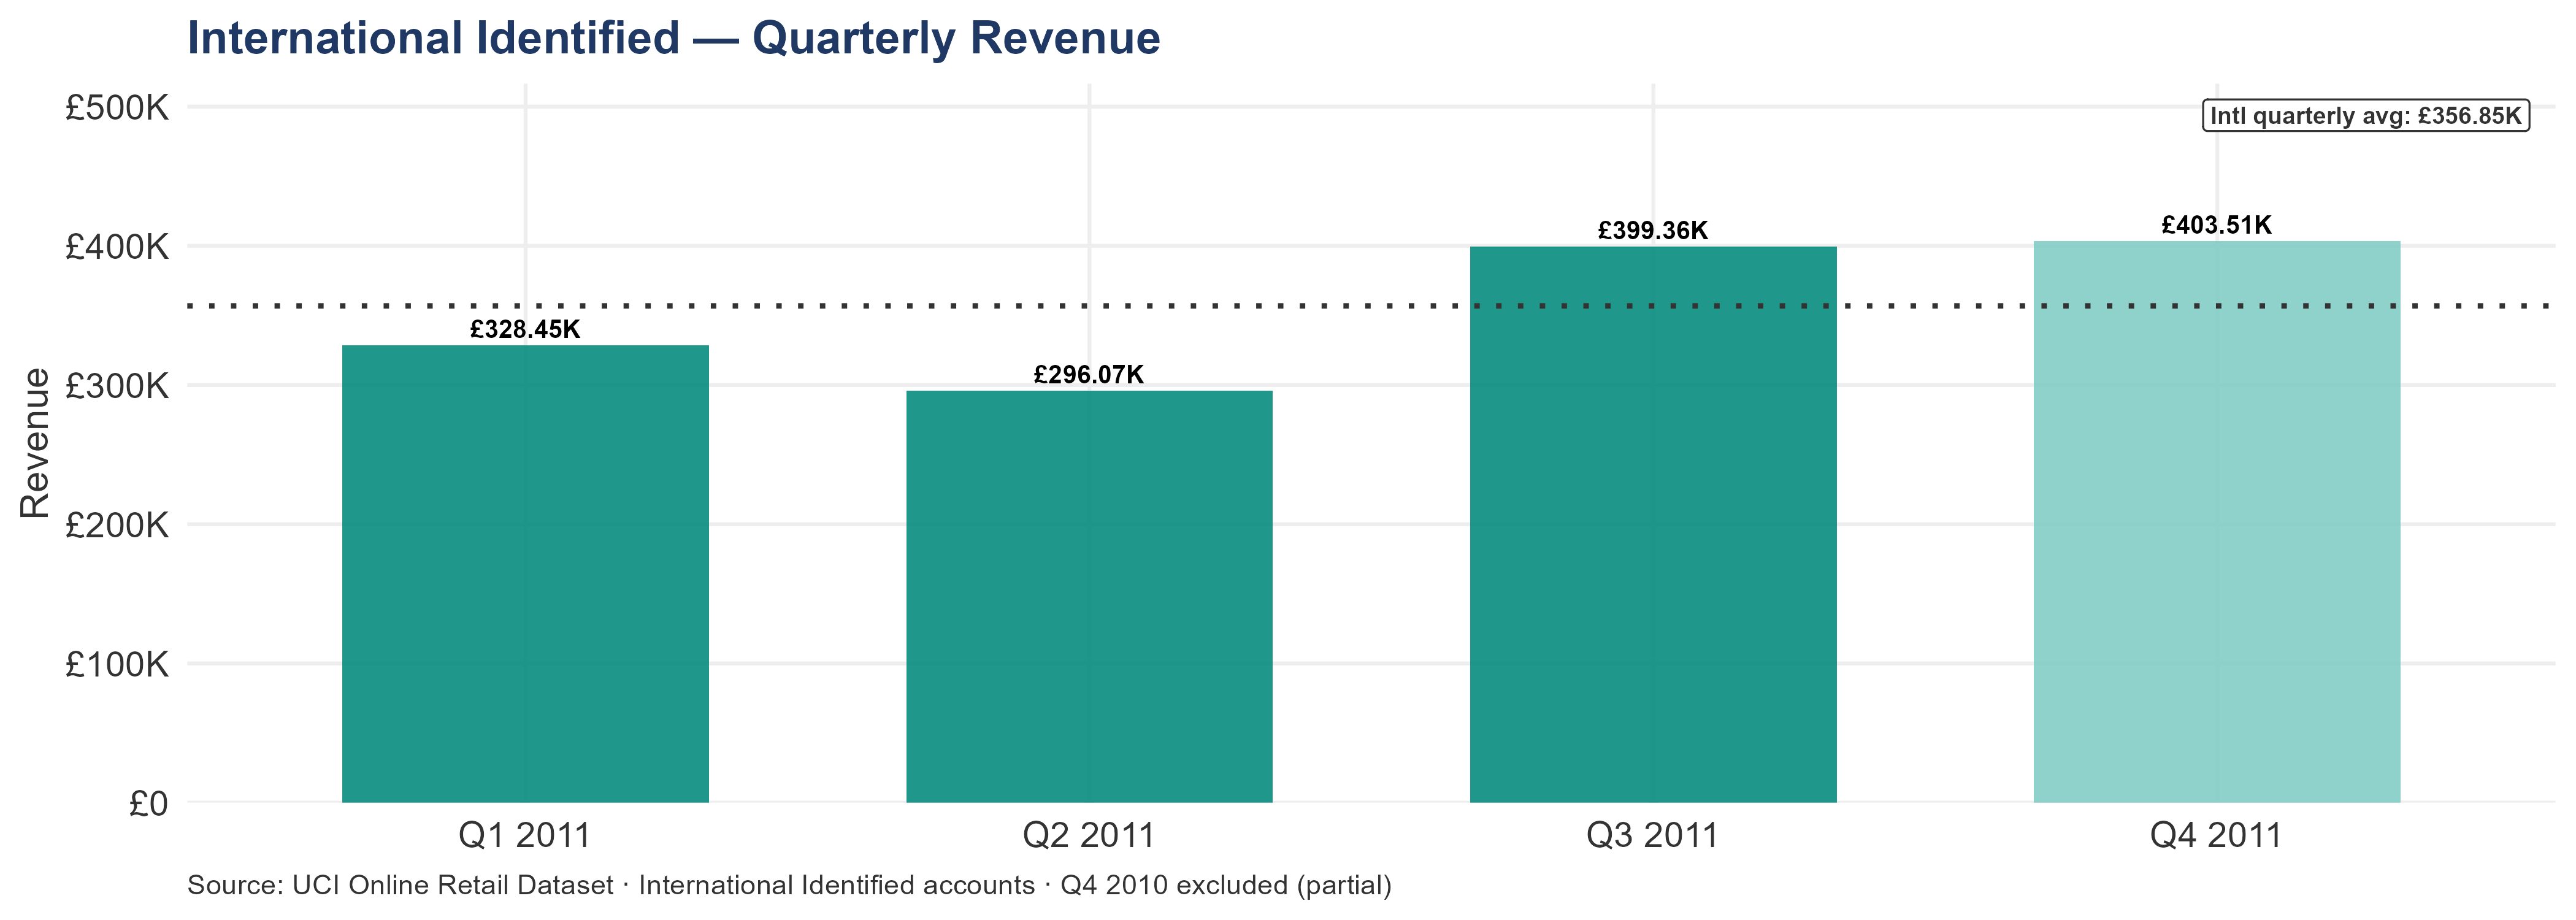
The International quarterly average is £356.85K per quarter. The UK segment quarterly average is £1.63M — approximately 4.6x larger in absolute revenue terms, reflecting the difference in account base size (414 international accounts vs 3,914 UK accounts). However, the international segment generates its quarterly revenue from far fewer accounts — each account contributing more per quarter on average than a typical UK account. This is the segment’s commercial proposition: fewer, higher-value relationships.
Q3 (July–September) generated 27.98% of annual International revenue — £399.36K. For international accounts specifically, Q3 is not just a preparation window — it is the window in which stock confirmation conversations with high-value accounts must happen. International accounts have longer lead times than UK accounts: orders need to be confirmed earlier, shipping logistics need to be arranged, and any fulfillment issues discovered in Q3 cannot be resolved in time for Q4 delivery. A stock confirmation conversation that happens in October for a UK customer can still be acted on. The same conversation for an international customer may be too late.
The first half of 2011 (January–June) generated 43.75% of annual International revenue — £624.52K. H2 is heavier by design: Q4 falls in H2. This asymmetry is why an international account that was active in H1 and silent in H2 did not slow down for the summer — it went quiet precisely when the business needed it to be placing its largest orders. The 72 international accounts that lapsed in H2 are identified in Wallet & Momentum.
International Q4 concentration has a specific implication for deal timing. An acquirer who closes between August and October inherits Q4 ordering at the exact moment international accounts need stock confirmation and relationship continuity. Any integration disruption, team change, or system migration attempted during this window will directly impact the peak revenue period. The optimal close timing is either before August (leaving a full Q3 for relationship establishment) or after November (inheriting the business after Q4 is complete). An October close is the most challenging timing scenario: the new owner arrives with relationships unestablished, stock decisions already locked in, and no opportunity to intervene before Q4 peaks.
5.3 Revenue Concentration — A Dangerous Imbalance
The “Accounts needed to reach 80% of revenue” metric is the clearest concentration diagnostic. Fewer accounts needed means higher concentration — and a larger gap between the UK and international figures means a more divergent risk profile.
Only 84 accounts generate 80% of international revenue. In a segment of 414 accounts, that means a handful of relationships hold a majority of the segment’s value. Losing a single top-10 international account is not just an account-level event — it is a segment-level revenue event.
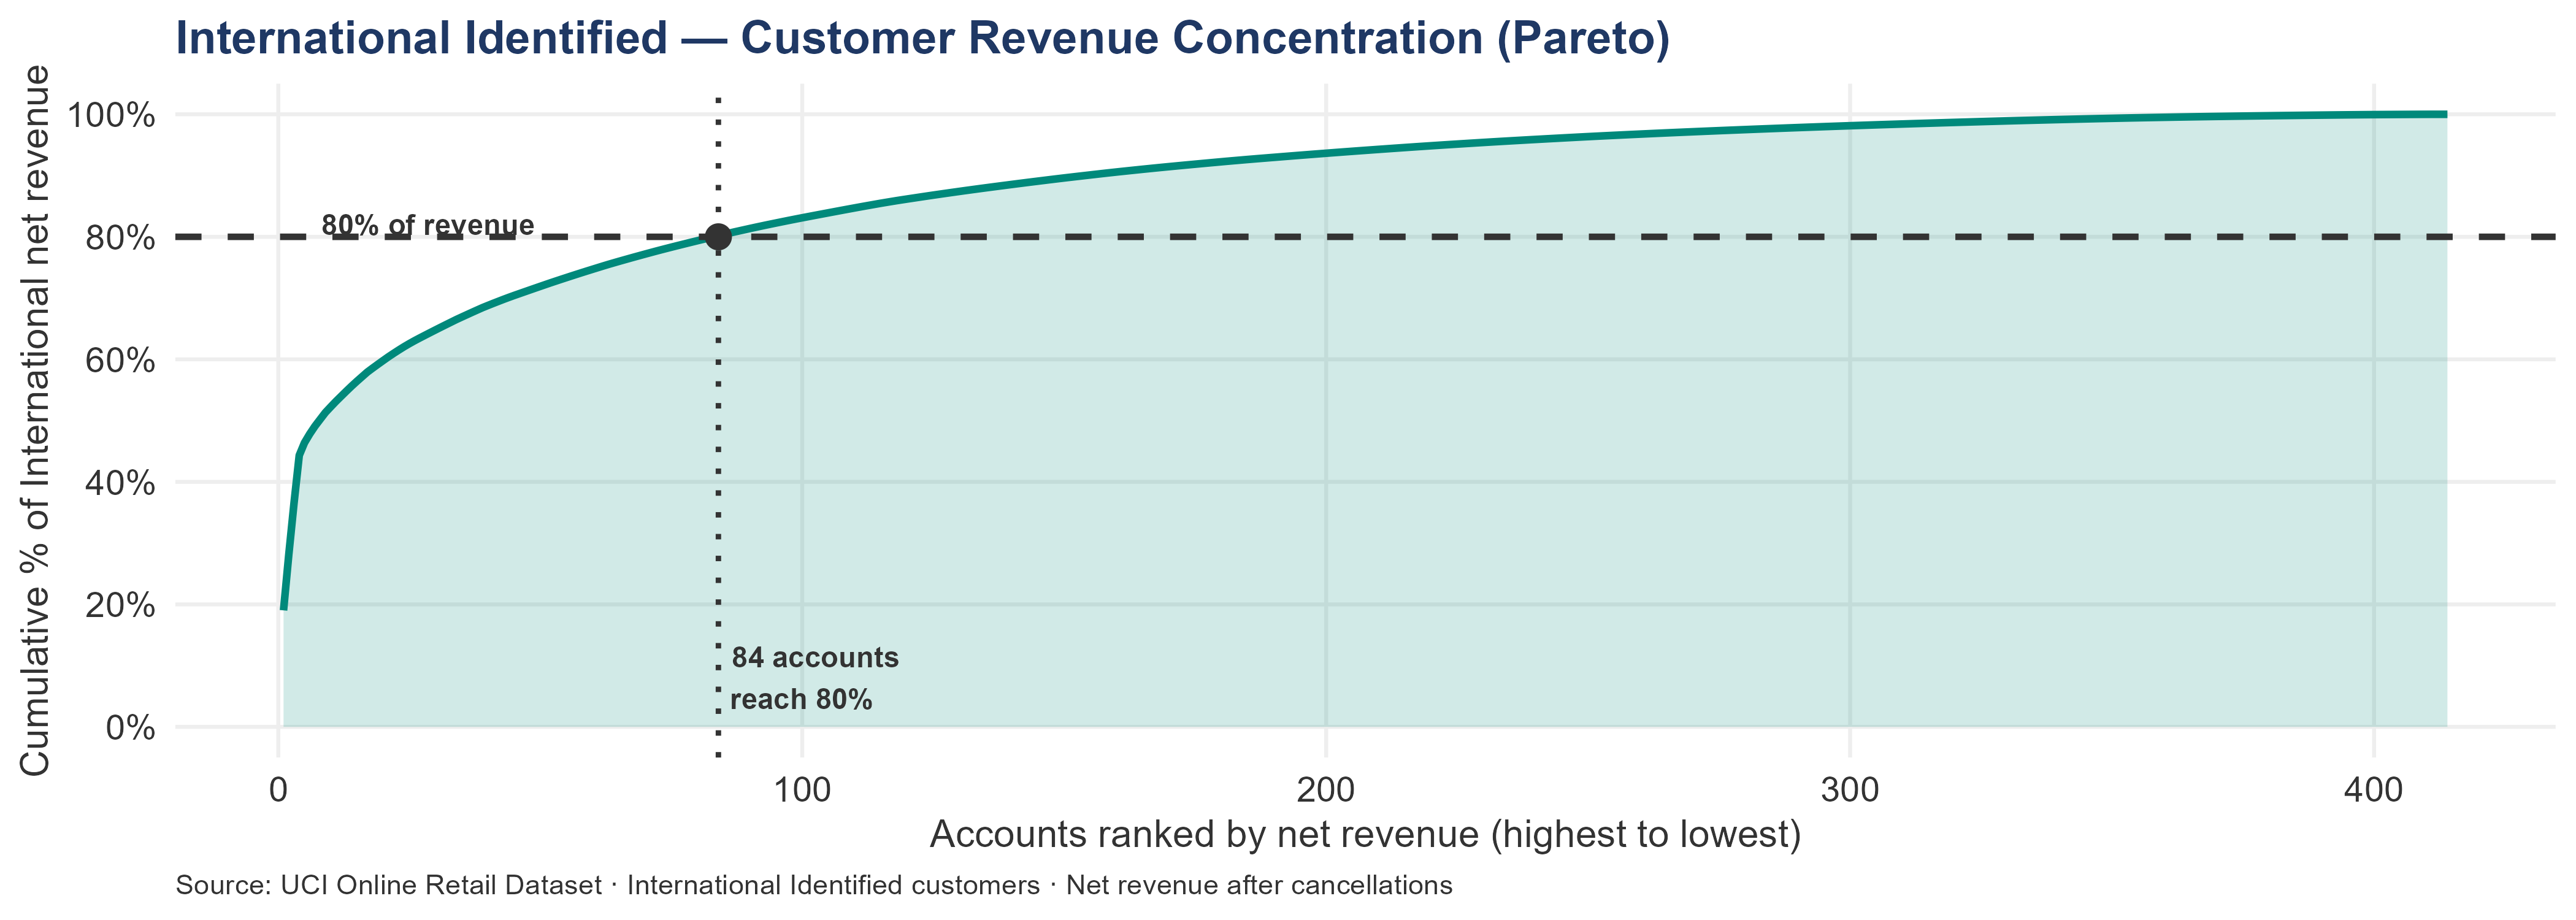
The top 10 international accounts generate 52.25% of all international revenue. Only 84 accounts are needed to reach 80% of revenue — in a segment of 414 customers. The equivalent figure for the UK segment is 1,115 accounts out of 3,914.
This comparison makes the International concentration risk concrete: the UK segment needs far more accounts to reach 80% of its revenue. The International segment achieves the same revenue threshold with a handful of relationships. When concentration is this severe, retention is not a commercial nice-to-have — it is the single most important operational priority in the segment.
The UK segment requires 1,115 accounts to reach 80% of its revenue — nearly 28% of its base. The International segment does it with 84 accounts — 20.29% of its base. This concentration makes international retention more urgent, but it also makes international growth more leveraged: adding or recovering even a handful of high-value international accounts moves the revenue needle materially.
| Metric | International | UK Identified |
|---|---|---|
| Total identified accounts | 414 | 3,914 |
| Accounts needed to reach 80% of revenue | 84 | 1,115 |
| % of accounts needed for 80% of revenue | 20.29% | 28.49% |
| Top 10 accounts — share of revenue | 52.25% | 13.97% |
| Top 4 accounts — share of revenue | 44.33% | — |
5.4 The Geographic Picture
Countries with high revenue from few accounts represent concentrated, high-value relationships — commercially attractive but risky. Countries with moderate revenue from many accounts represent diversified positions — more stable but less efficient per account.
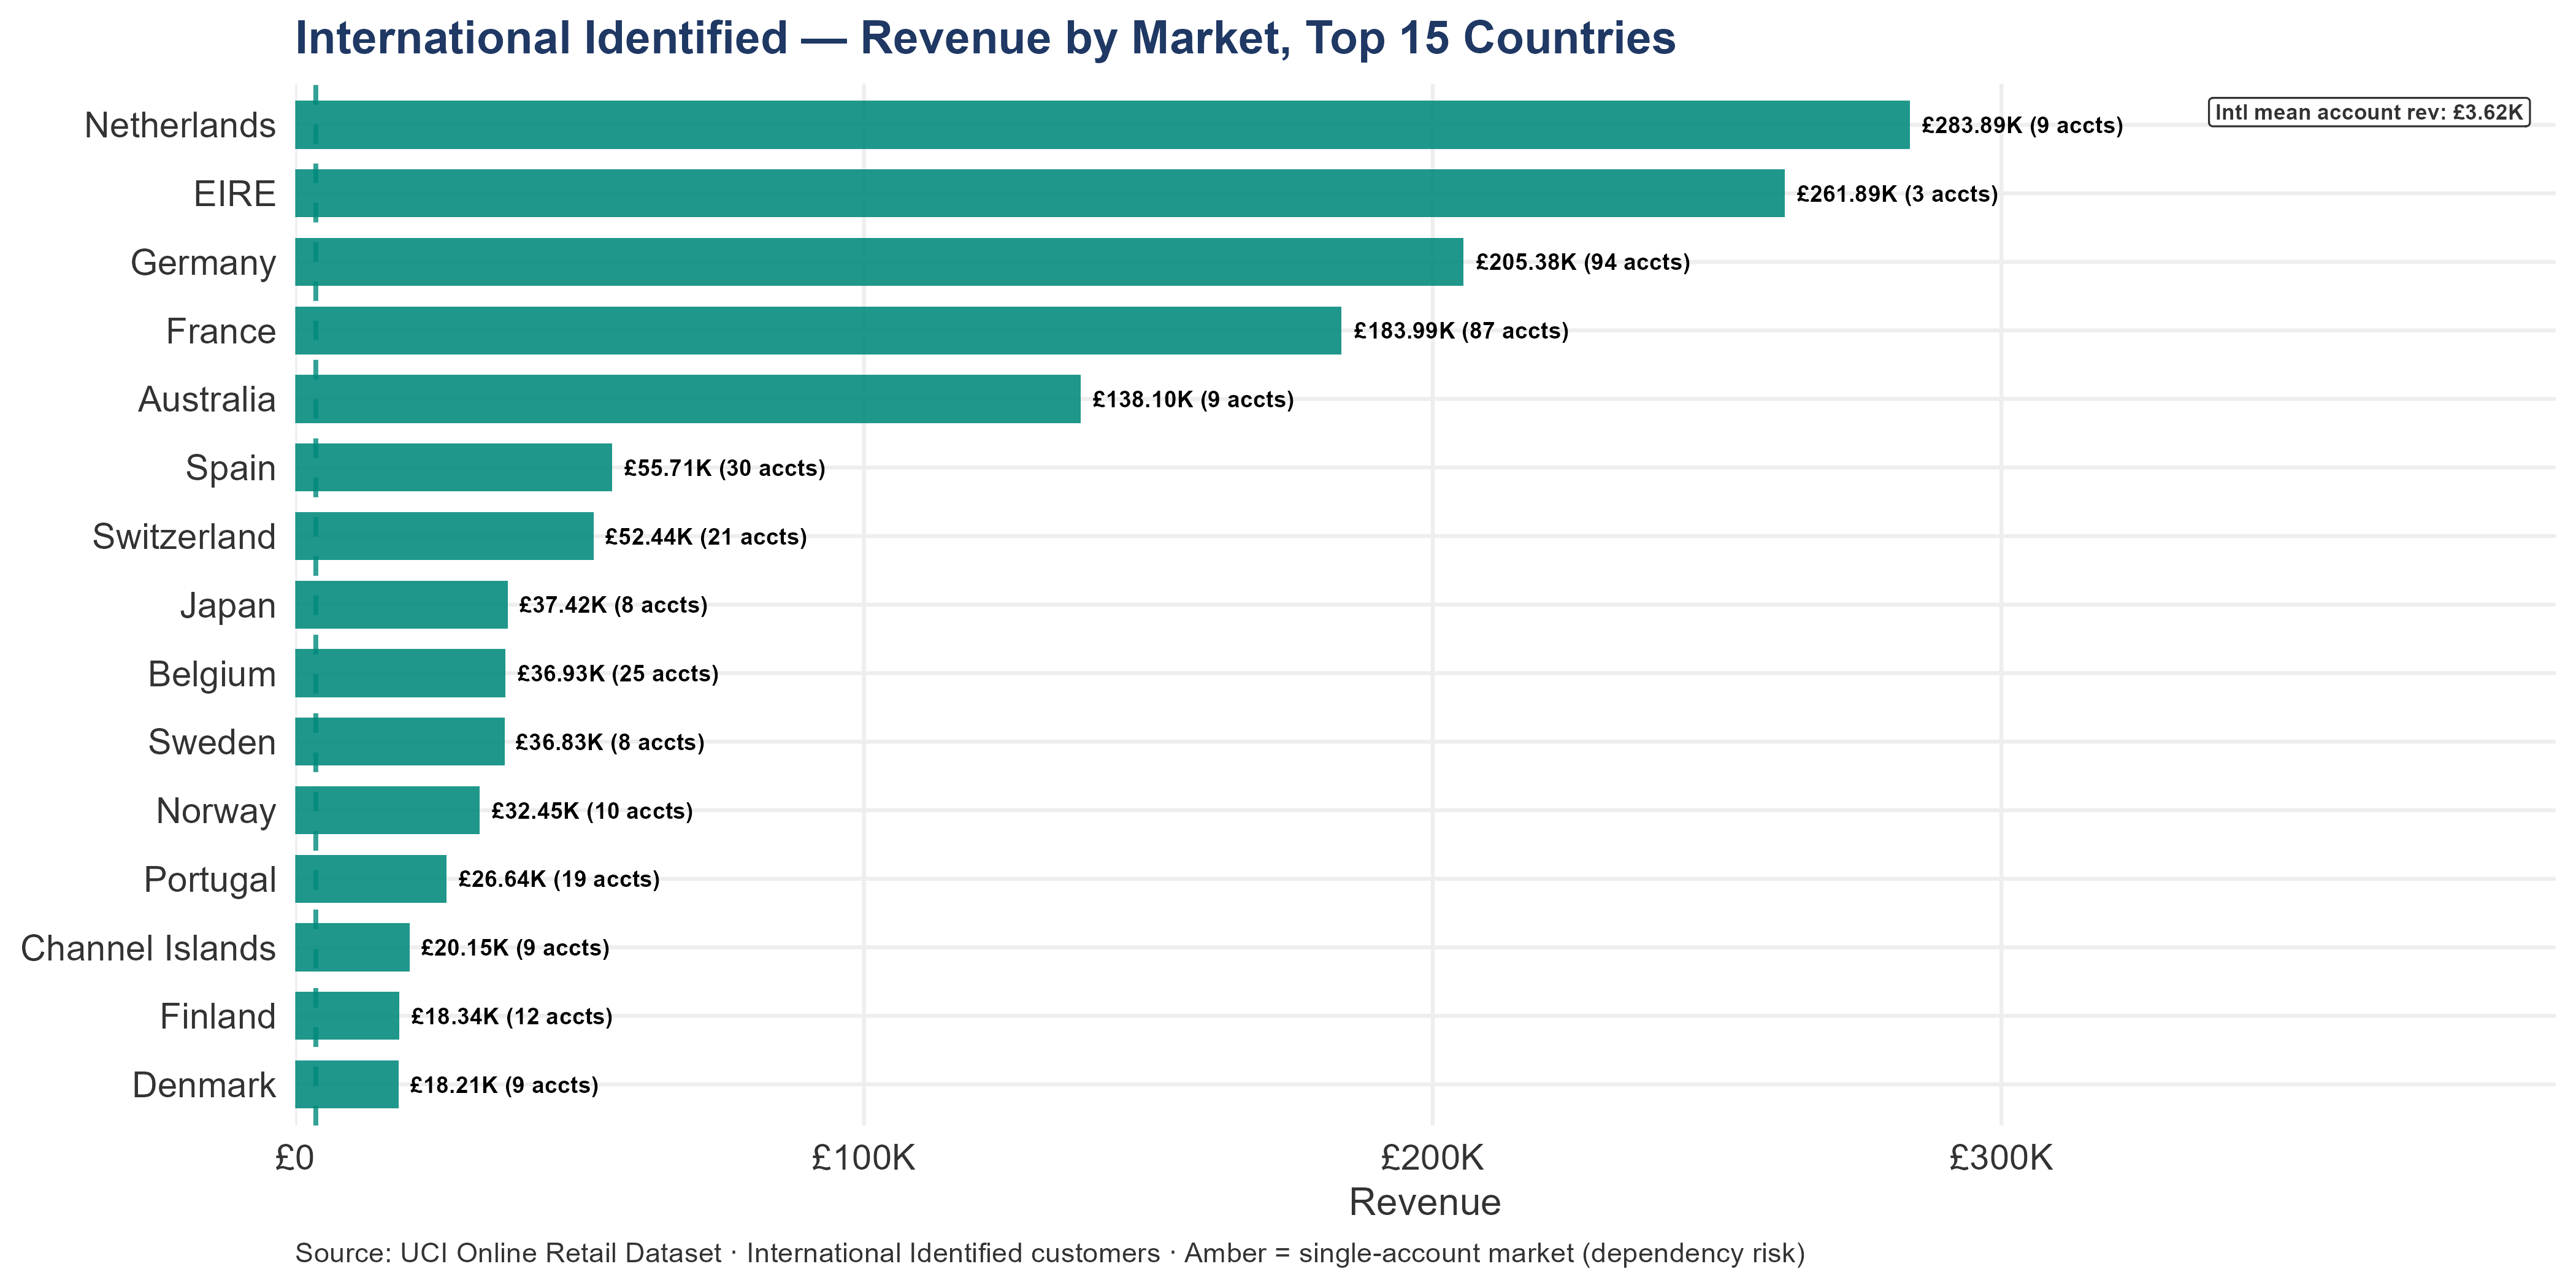
Of the 35 international markets, 9 are single-account markets — every order from that country comes from one account. Combined revenue from single-account markets: £21.02K. In a single-account market, ‘market revenue’ and ‘account revenue’ are the same number. There is no portfolio effect, no diversification, no backup. If that account stops ordering, the market goes to zero immediately.
The largest single-account markets are not necessarily the highest-risk ones — an account that has been ordering consistently for 13 months is a more stable relationship than one that placed a single large order. The Account Landscape section below examines individual account behavior; the table below identifies exactly which markets and accounts carry structural dependency risk.
| Market | Account ID | Gross Revenue | Net Revenue |
|---|---|---|---|
| Singapore | 12744 | £9.12K | £9.12K |
| Iceland | 12347 | £4.31K | £4.31K |
| Lebanon | 12764 | £1.69K | £1.69K |
| Lithuania | 15332 | £1.66K | £1.66K |
| European Community | 15108 | £1.16K | £1.15K |
| Brazil | 12769 | £1.14K | £1.14K |
| RSA | 12446 | £1.00K | £1.00K |
| Czech Republic | 12781 | £787 | £672 |
| Saudi Arabia | 12565 | £146 | £131 |
Single-account market risk and regional concentration risk are related — a region built primarily on single-account markets has no portfolio buffer at any level. The regional breakdown below shows how these risks cluster geographically.
5.4.1 International Revenue by Region
How does international revenue break down across geographic regions — and which regions carry the most commercial weight?
Regional groupings allow the account team to structure ownership, plan around shared market characteristics (holidays, logistics, currency, language), and identify where revenue concentration risk clusters geographically. The regions used in this report are defined as follows:
| Region | Markets Included |
|---|---|
| Western Europe | Germany, France, Belgium, Netherlands, Switzerland, Austria, Portugal, Spain, Sweden, Norway, Finland, Denmark, Iceland |
| British Isles | Eire, Channel Islands |
| Asia-Pacific | Australia, Japan, Singapore |
| Middle East | United Arab Emirates, Bahrain, Lebanon, Saudi Arabia, Israel |
| Eastern Europe | Poland, Lithuania, Czech Republic |
| Mediterranean | Italy, Cyprus, Greece, Malta |
| Americas | USA, Canada, Brazil |
| Africa | RSA (Republic of South Africa) |
| Unspecified | Accounts with no country recorded — blank or marked ‘Unspecified’ in the dataset. |
Every identified international account falls into one of these nine regions. No catch-all bucket — each country has a named regional home.
Note: EIRE (Ireland) accounts are classified as International in this analysis because they appear as a separate country in the transaction data. The three EIRE accounts generated significant transaction volume. An acquirer operating in the UK/Ireland market should note that EIRE accounts may have different commercial relationships than continental European accounts.
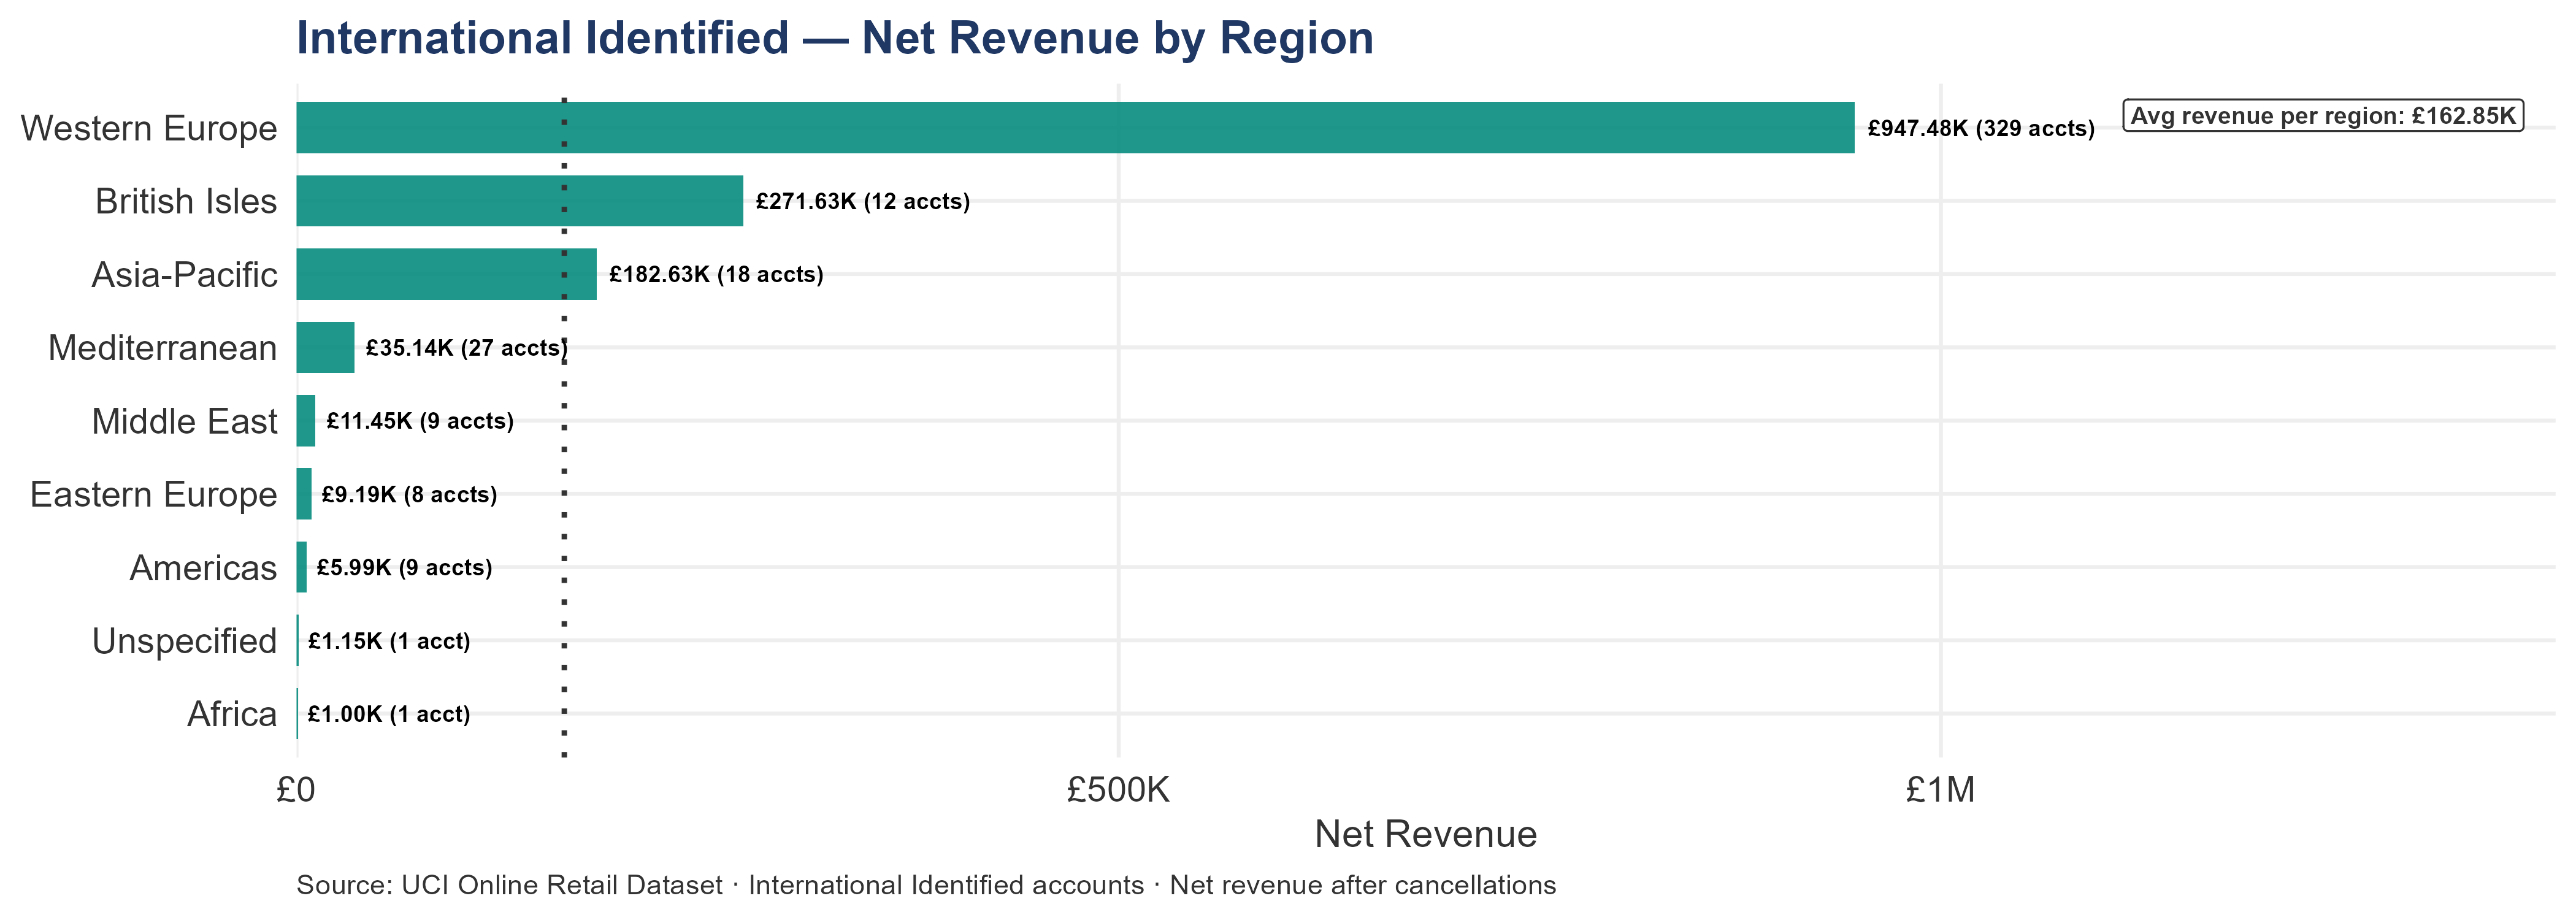
Western Europe generates 64.64% of international revenue from 329 accounts. The next two regions — British Isles and Asia-Pacific — together account for approximately 30.99% more. Everything below that is commercially minor in absolute terms. An account team that does not have Western Europe covered first is misallocating its attention. For context, the entire international segment generates 14.57% of total business revenue from just 9.57% of identified accounts — a revenue-to-account ratio the UK segment does not match.
For a strategic buyer, regional concentration in Western Europe has a specific due diligence implication: existing distribution infrastructure in this region reduces cost-to-serve and improves effective margin per account without changing list price. A buyer who already operates in the Netherlands, Germany, France, or EIRE captures the international segment’s revenue at lower operational cost than a standalone operator. This is the primary synergy argument for a strategic buyer over a financial buyer — the same account relationships generate higher net margin under a buyer with regional infrastructure.
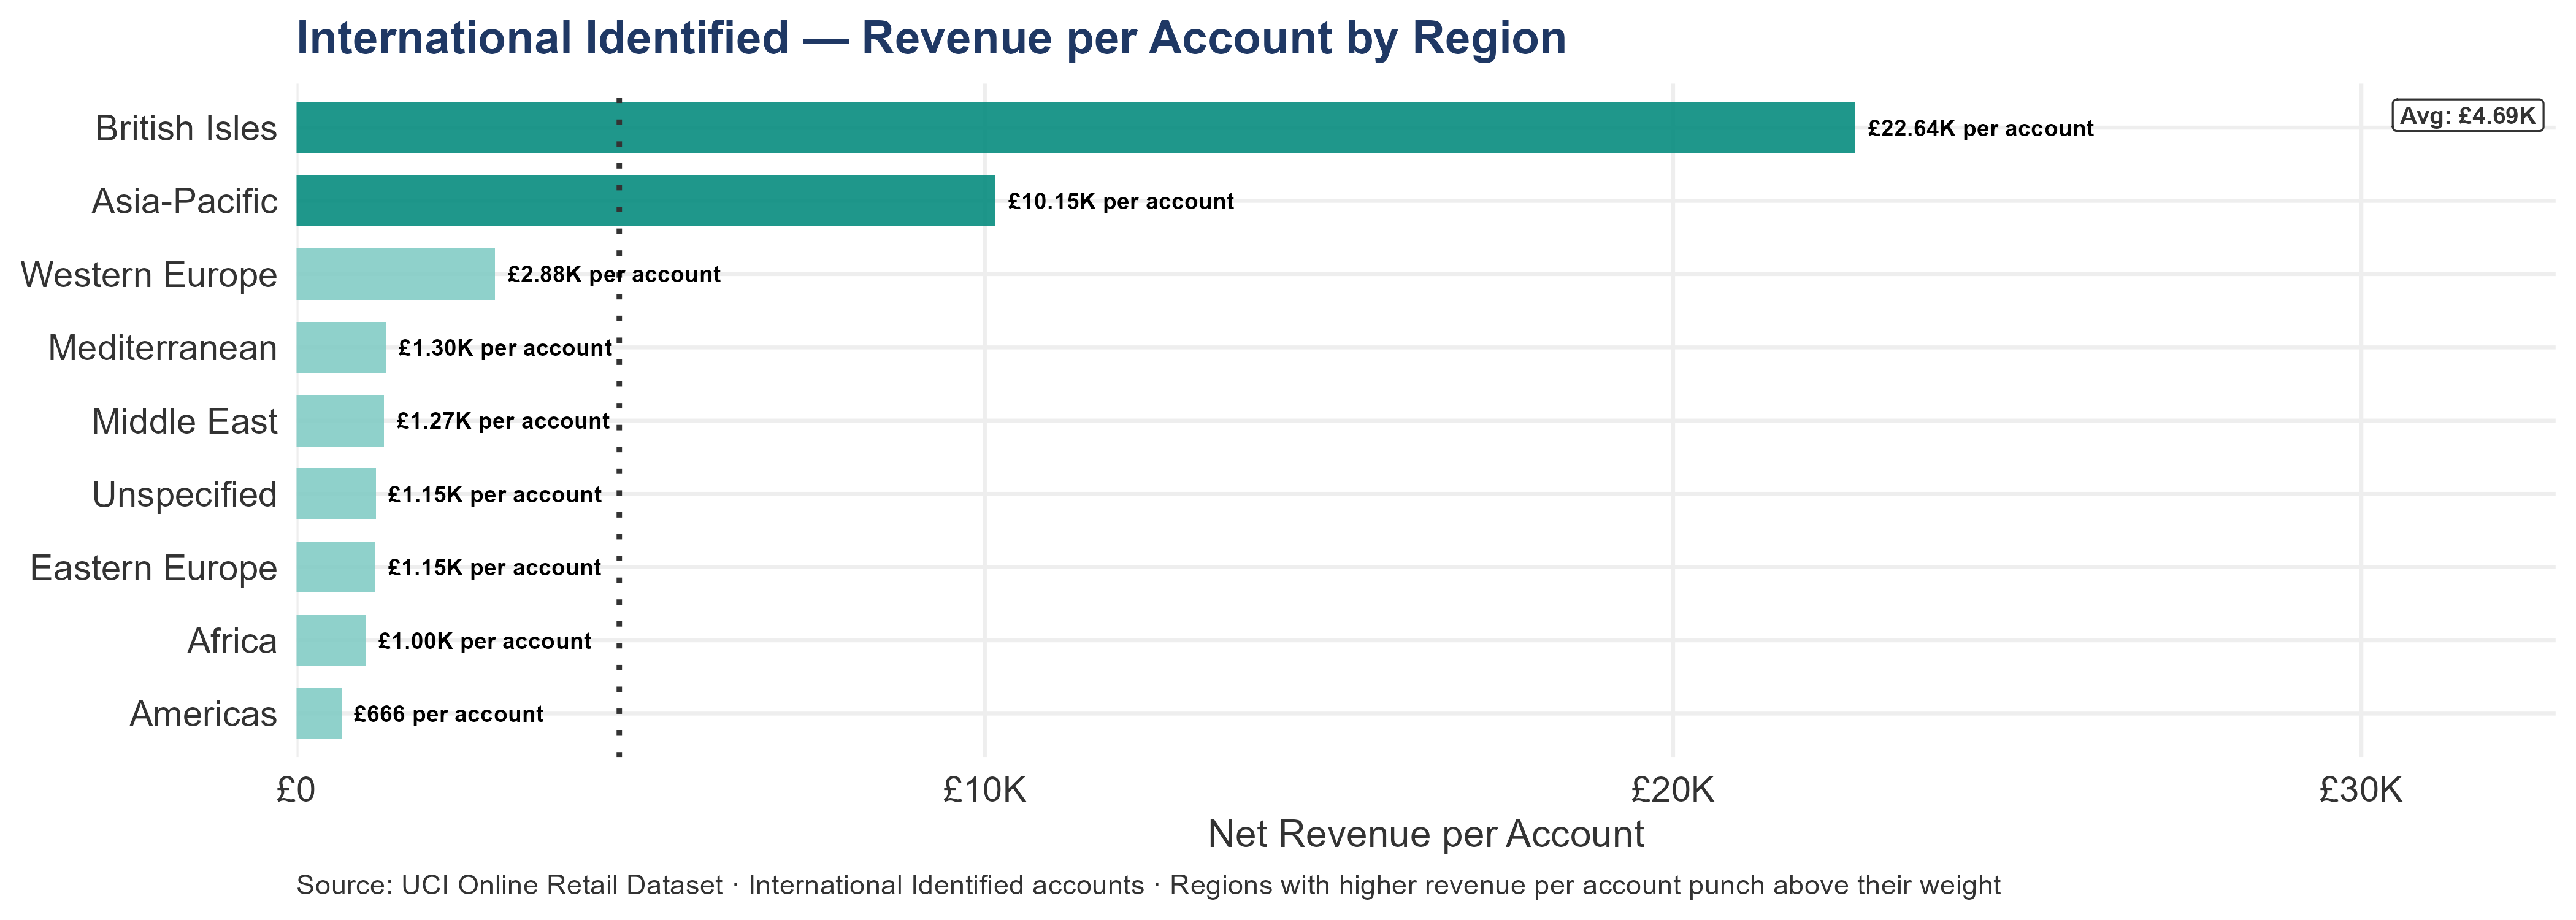
British Isles generates £22.64K per account — the highest of any region. This means each British Isles account relationship carries more revenue weight than any other region, including Western Europe. A region with high revenue per account and few accounts is the segment’s highest value-density portfolio: every relationship matters more, and the cost of losing one is proportionally higher. Asia-Pacific is the second-highest per account. Both regions deserve management intensity disproportionate to their account count.
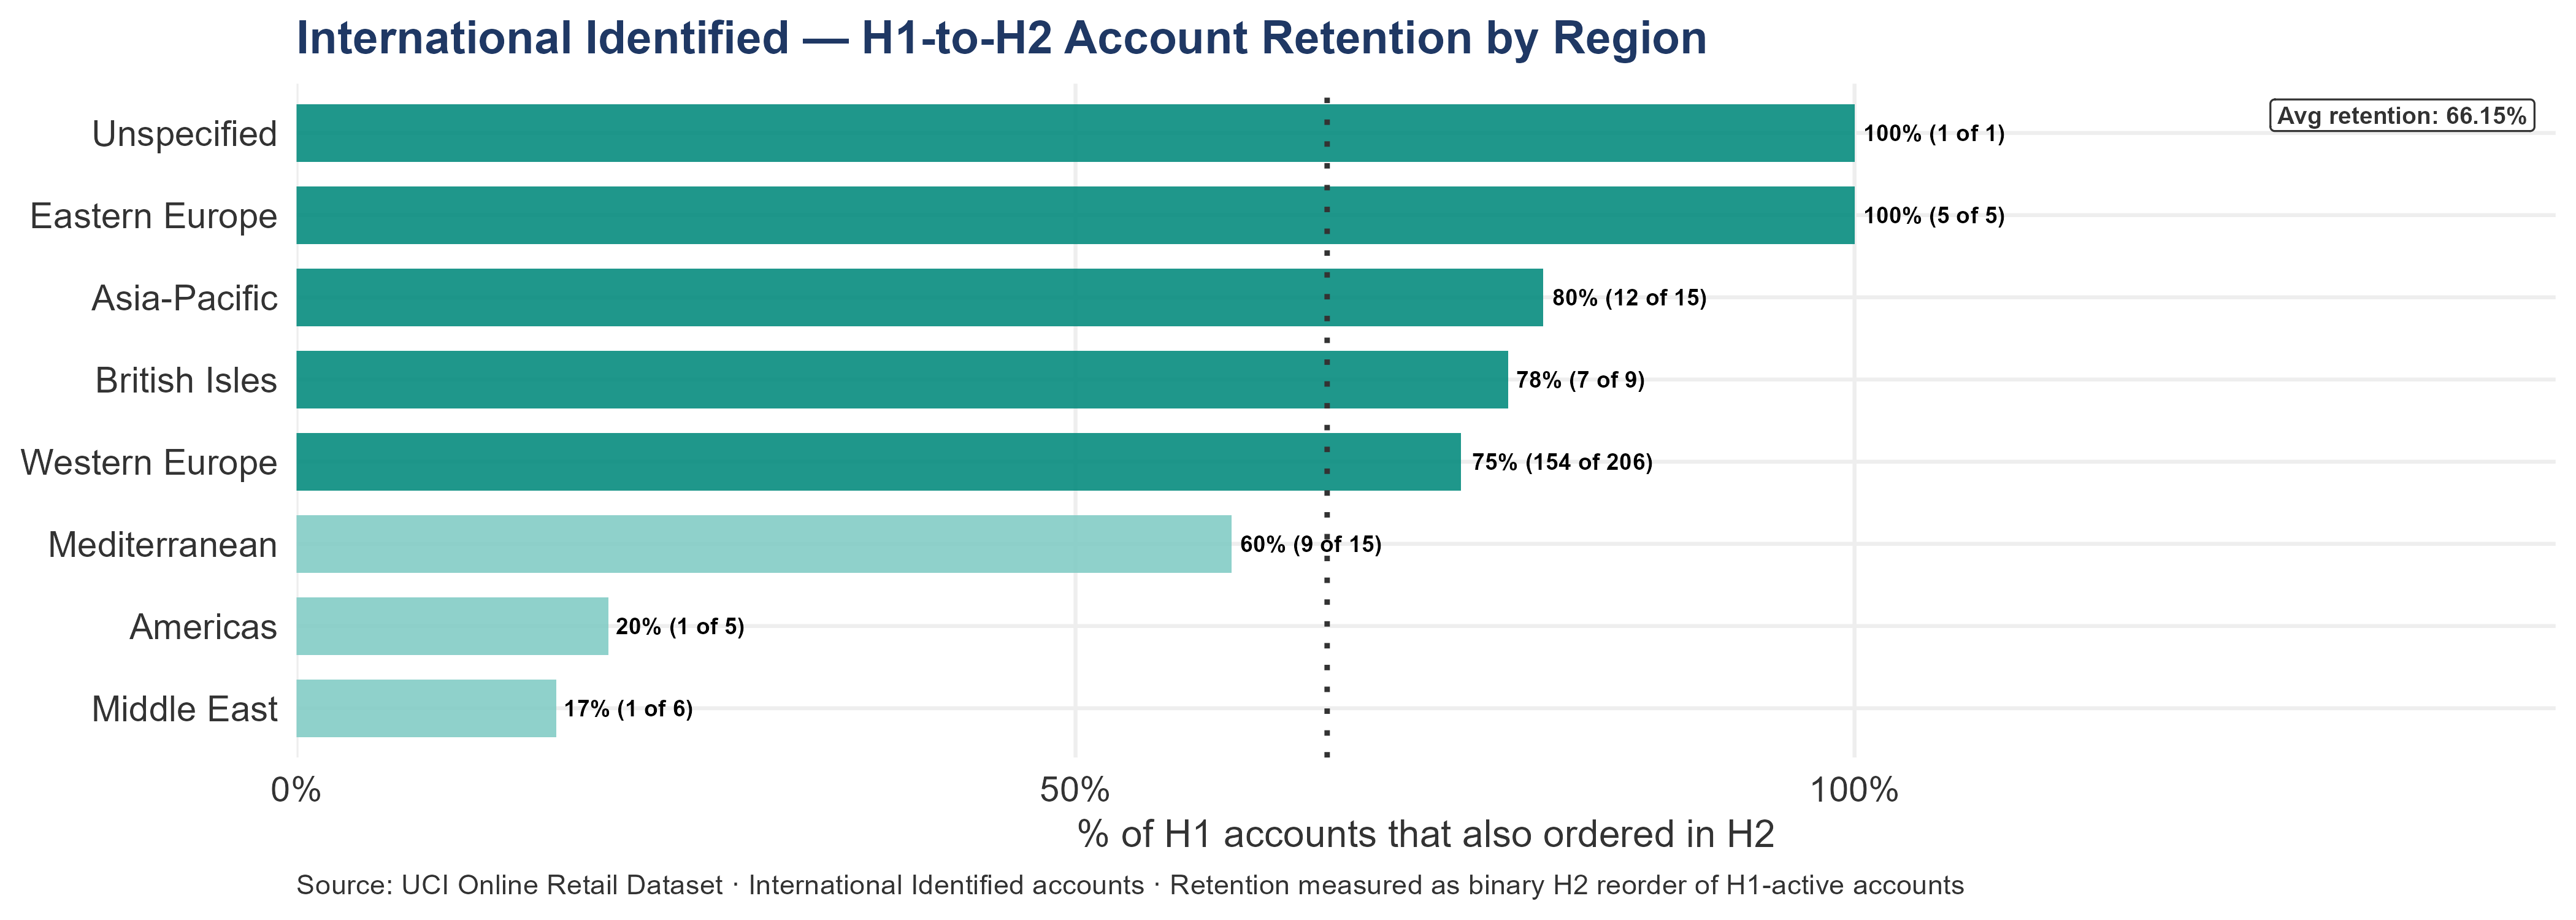
Middle East had very low H1-to-H2 retention — before treating this as individual account churn, check for a shared cause: logistics disruptions, pricing issues, regulatory changes, or fulfillment problems affecting all Middle East shipments simultaneously. Americas also had low retention. Both regions warrant a region-level investigation before individual account outreach begins.
Regional retention failures are more concerning than individual account churn because they may reflect systemic problems that persist after ownership change. A single account going silent is a relationship problem — fixable with outreach. An entire region going silent is an operational or structural problem — which may require a different response entirely. Before close, request any operational records, shipping logs, or customer correspondence relating to Middle East and Americas accounts in H2 2011. If the silence reflects a specific logistics partner failure or a regulatory barrier that has since been resolved, the lost revenue is recoverable. If it reflects a structural market access problem, the acquirer needs to understand whether they have the capability to serve these markets better than the current operator before assigning any value to account recovery programs in these regions.
| Region | Accounts | Net Revenue | % of Intl Rev | Rev per Account | H1-H2 Retention | H2 Account Loss |
|---|---|---|---|---|---|---|
| Western Europe | 329 | £947.48K | 64.64% | £2.88K | 74.76% | 25.24% |
| British Isles | 12 | £271.63K | 18.53% | £22.64K | 77.78% | 22.22% |
| Asia-Pacific | 18 | £182.63K | 12.46% | £10.15K | 80.00% | 20.00% |
| Mediterranean | 27 | £35.14K | 2.40% | £1.30K | 60.00% | 40.00% |
| Middle East | 9 | £11.45K | 0.78% | £1.27K | 16.67% | 83.33% |
| Eastern Europe | 8 | £9.19K | 0.63% | £1.15K | 100.00% | 0.00% |
| Americas | 9 | £5.99K | 0.41% | £666 | 20.00% | 80.00% |
| Unspecified | 1 | £1.15K | 0.08% | £1.15K | 100.00% | 0.00% |
| Africa | 1 | £1.00K | 0.07% | £1.00K | — | — |
Western Europe is the dominant region — 64.64% of international revenue from 329 accounts. This region should have a named regional owner and a structured account review cadence.
British Isles generates the highest revenue per account — £22.64K per account. Regions with high revenue per account carry disproportionate value per relationship. Each account in this region deserves more management attention relative to its count than a region with many low-value accounts.
Middle East had the weakest H1-to-H2 retention among regions with 3+ H1-active accounts: 16.67% of its H1 accounts remained active in H2. This warrants a region-level investigation — shared causes (local economic conditions, competitor activity, logistics issues) should be ruled out before treating these as isolated account-level churn events.
⚠ Middle East H1-to-H2 retention is 16.67%. Of the 6 Middle East accounts that ordered in H1, only 1 ordered again in H2. At this scale, near-total silence across a region is unlikely to be coincidence. Check for a shared fulfillment, logistics, or compliance issue affecting all shipments to the region before treating each account as a separate churn event.
NoteNote on Unspecified Country Accounts
A total of 1 international identified account has no country recorded in the dataset — their country field is blank or marked ‘Unspecified’. These accounts generated £1.16K in gross revenue across the analysis period. They appear in total segment revenue figures but cannot be attributed to any market. As a result, all market-level analyses in this chapter — country revenue shares, single-account market identification, and the H1/H2 country breakdown — undercount the true international account base by 1 account. Until that attribution is resolved, treat all market-level percentages in this chapter as lower bounds on actual market exposure.
This is a persistent data quality problem, not a new one. The 1 unspecified account ordered across the analysis period without ever having a country recorded. The account is a repeat customer with no geographic attribution and no regional owner. It cannot appear in any market-level analysis, cannot be assigned to a regional manager, and cannot be contacted through any market-specific outreach program. The absence of a country field is not a minor data gap — it is a relationship management gap for accounts that have already demonstrated they will reorder.
| Account ID | Gross Revenue | Orders |
|---|---|---|
| 15108 | £1.16K | 3 |
Four international accounts have no country recorded in the transaction data. These accounts are included in segment revenue totals but excluded from regional analyses due to missing country attribution. Pre-close verification request: confirm country of business for these 4 accounts.
5.5 The Account Landscape
The “H1/H2” trajectory indicator shows whether each account accelerated, decelerated, or held steady between halves. An account that decelerated heading into Q4 — the busiest period — is a relationship that may be cooling.
This section identifies the specific accounts that determine International segment outcomes. There are 414 International Identified accounts. The account-level analysis here is structured around three questions: which accounts are generating the most revenue, which accounts are losing ground across H1→H2, and which accounts have gone silent and need immediate contact.
5.5.1 Account Tiers by Net Revenue
The median international account generates £905 in net revenue. The mean is £3.54K — 3.9x the median. This gap is the signature of the concentration problem: a small number of Frequent customers generate enough revenue to pull the average far above what a typical account produces. Most accounts sit well below the mean — planning to the mean overstates what the typical relationship delivers and understates what the top relationships are worth.
5.5.2 Tier 1 — Strategic Accounts (Top 10 by Net Revenue)
| Customer ID | Country | Country Accts | Net Revenue | % of Intl Rev | Orders | Median AOV | Last Order | H2 vs H1 Rev | Status |
|---|---|---|---|---|---|---|---|---|---|
| 14646 | Netherlands | 9 | £278.78K | 19.02% | 72 | £3.88K | 2011-12-08 | +20% | Active |
| 14911 | EIRE | 3 | £132.89K | 9.07% | 199 | £705 | 2011-12-08 | +172% | Active |
| 12415 | Australia | 9 | £123.64K | 8.44% | 20 | £6.23K | 2011-11-15 | -32% | Active |
| 14156 | EIRE | 3 | £114.34K | 7.80% | 55 | £2.13K | 2011-11-30 | +20% | Active |
| 17404 | Sweden | 8 | £30.18K | 2.06% | 13 | £2.44K | 2011-12-05 | +117% | Active |
| 12753 | Japan | 8 | £21.02K | 1.43% | 6 | £3.57K | 2011-11-17 | +29% | Active |
| 12731 | France | 87 | £18.66K | 1.27% | 12 | £1.56K | 2011-11-16 | +20% | Active |
| 12678 | France | 87 | £16.44K | 1.12% | 10 | £1.65K | 2011-10-28 | +110% | Monitor |
| 12471 | Germany | 94 | £16.32K | 1.11% | 27 | £644 | 2011-12-07 | +235% | Active |
| 12433 | Norway | 10 | £13.38K | 0.91% | 7 | £1.91K | 2011-12-09 | — | Active |
The top 4 accounts (shaded green) generate 44.33% of all international revenue. Any silence flag in this top 4 group represents an immediate, quantifiable revenue exposure — at this concentration level, a single non-transferring relationship is a segment-level revenue event.
Author: Shawn Phillips | Lailara LLC
← UK Customer Landscape | Customer Growth & Cohort Retention →