4 UK Customer Landscape
4.1 A Solid Engine, Quietly Leaking Value
The UK segment is the primary revenue engine of the business: 3,914 accounts generating £6.80M net of cancellations. The headline numbers look healthy — product distribution is diversified, and the top 10 accounts generate a manageable 13.97% of UK revenue.
But beneath the surface, the engine is leaking.
34.5% of all UK customers placed a single order and never returned. There is no evidence the business operates any follow-up program to bring them back. Meanwhile, 687 established UK relationships went completely silent before the busiest quarter of the year, taking £353.23K in historical half-year revenue with them.
Frequent accounts are 9.02% of the UK base but generate 51.17% of UK revenue. The UK segment has 353 Frequent accounts (10+ orders), and they produce more than half of all UK revenue. That disproportionate weight means a single lost Frequent account creates a revenue impact far larger than its headcount share. Named ownership for all Frequent accounts — at minimum the top 10 — is a post-close requirement, not a nice-to-have.
1,352 UK accounts placed one order and never returned, and this is not a historical figure — it is the current operating rate. Every day, approximately 5 new UK accounts complete their first order and enter a 30-day window during which systematic contact would convert a meaningful share to returning customers. The business currently has no documented day-30 follow-up program. A program that costs account manager time and a basic CRM trigger would produce approximately £87K in 3-year portfolio gain at a 10-percentage-point improvement. Every month between close and implementation is a month of new one-timers exiting that window permanently.
Between H1 and H2, 687 UK accounts went completely silent, carrying combined H1 revenue of £353.23K — and none of it transferred. These accounts represent zero-acquisition-cost reactivation opportunities. A new owner reaching out to lapsed accounts also introduces the change in ownership — two purposes in one contact. Accounts that lapsed due to service or relationship issues with prior management may be easier to reactivate under new ownership than they would have been for the incumbent team. The data cannot distinguish the cause of lapse; only a contact call can.
The top 781 SKUs generate 80% of UK revenue; the remaining 2,858 generate 20%. For inventory evaluation, the top 781 SKUs warrant Q4 stock confirmation, supplier contract review, and pricing audit. The long tail — 2,858 SKUs — are candidates for catalog rationalization, dead-stock clearance, or exclusion from any asset valuation that attempts to value inventory at full retail price.
The UK median reorder interval is 52 days. Accounts silent for 90+ days have missed at least one full purchasing cycle; 270 days means roughly five. Accounts silent 270+ days at the date of this data are the most urgent outreach targets: they are either already churned (to be written off) or recoverable with direct contact at zero acquisition cost. The Wallet & Momentum account tables stratify these accounts by revenue and days-silent to enable immediate prioritization.
The UK segment is the business’s volume base (3,914 accounts, £7.00M gross revenue). The international segment has materially stronger per-account economics — higher median revenue per account and higher per-order value — but only 414 accounts versus 3,914 UK. The acquisition case requires both segments: UK for at-scale retention programs with high absolute impact, international for per-account programs with high per-account return. The two segments cannot be managed from one team at the required quality — see the post-close priority chapters for the recommended structure.
4.2 The UK Profile
The segment contains 3,914 accounts generating £7.00M in gross revenue across 16,576 orders.
Understanding the revenue distribution. The median UK account generates £644 in gross revenue over the analysis period. The mean is £1.79K — significantly higher. When the mean is nearly three times the median, it tells you the distribution is lopsided: a small number of high-revenue accounts are pulling the average well above what a typical account generates. This matters for planning. Use medians when thinking about what a normal customer looks like. Use means only when modeling the full portfolio including the outliers.
The same pattern shows up at the order level: median order value is £299, mean is £422. A small number of large orders carry disproportionate commercial weight.
Four natural tiers. UK customers sort into four groups based on how often they order:
The segment contains 3,914 accounts generating £7.00M in gross revenue across 16,576 orders during the analysis period. Net revenue after cancellations is lower — the specific accounts driving that gap are identified later in this chapter.
The median UK account generates £644 in gross revenue across the analysis period. The mean is £1.79K — meaningfully higher than the median. The gap between mean and median is a diagnostic: in a perfectly even distribution they are equal. Here the mean is 2.8× the median, which is the signature of a concentrated distribution where a small number of high-revenue accounts pull the average above what a typical account generates. This means average-based metrics — average revenue per account, average order value — systematically overstate what the business should expect from most accounts and understate what it should expect from its best ones. Use medians for typical-account planning; use means only when explicitly modeling the full portfolio.
The mean order value is £422; the median is £299. The same concentration pattern appears at the order level: a small number of large orders pull the mean well above the typical transaction. For stock planning and fulfillment capacity, the median order value is the better reference. For revenue concentration risk, the mean order value signals that some orders carry disproportionate commercial weight — and losing one of those orders has an outsized impact.
Frequent customers (10+ orders) make up just 9.0% of the base but generate 51.2% of revenue. They reorder on a predictable rhythm. Regular customers (4–9 orders) sit in the middle. Occasional customers (2–3 orders) are lighter touch. One-time customers — 34.5% of the base — ordered once and did not return.
The commercial question is whether the business treats these groups differently. The transaction record suggests it treats them all the same.
UK vs International — a quick comparison. The UK segment is the volume engine (3,914 accounts, £7.00M gross). The international segment has stronger per-account economics — higher median revenue per account and higher per-order value — but only 414 accounts. The acquisition case requires both: UK for programs that work at scale with high absolute impact, international for programs targeting individual high-value accounts. The two segments have different enough profiles that they benefit from different management approaches.
| Tier | Accounts | % of Accounts | Total Net Revenue | % of Revenue | Median Revenue |
|---|---|---|---|---|---|
| One-time (1 order) | 1,352 | 34.54% | £435.45K | 6.40% | £239 |
| Occasional (2–3 orders) | 1,206 | 30.81% | £979.76K | 14.39% | £608 |
| Regular (4–9 orders) | 1,003 | 25.63% | £1.91M | 28.04% | £1.56K |
| Frequent (10+ orders) | 353 | 9.02% | £3.48M | 51.17% | £5.03K |
4.3 The Operating Map
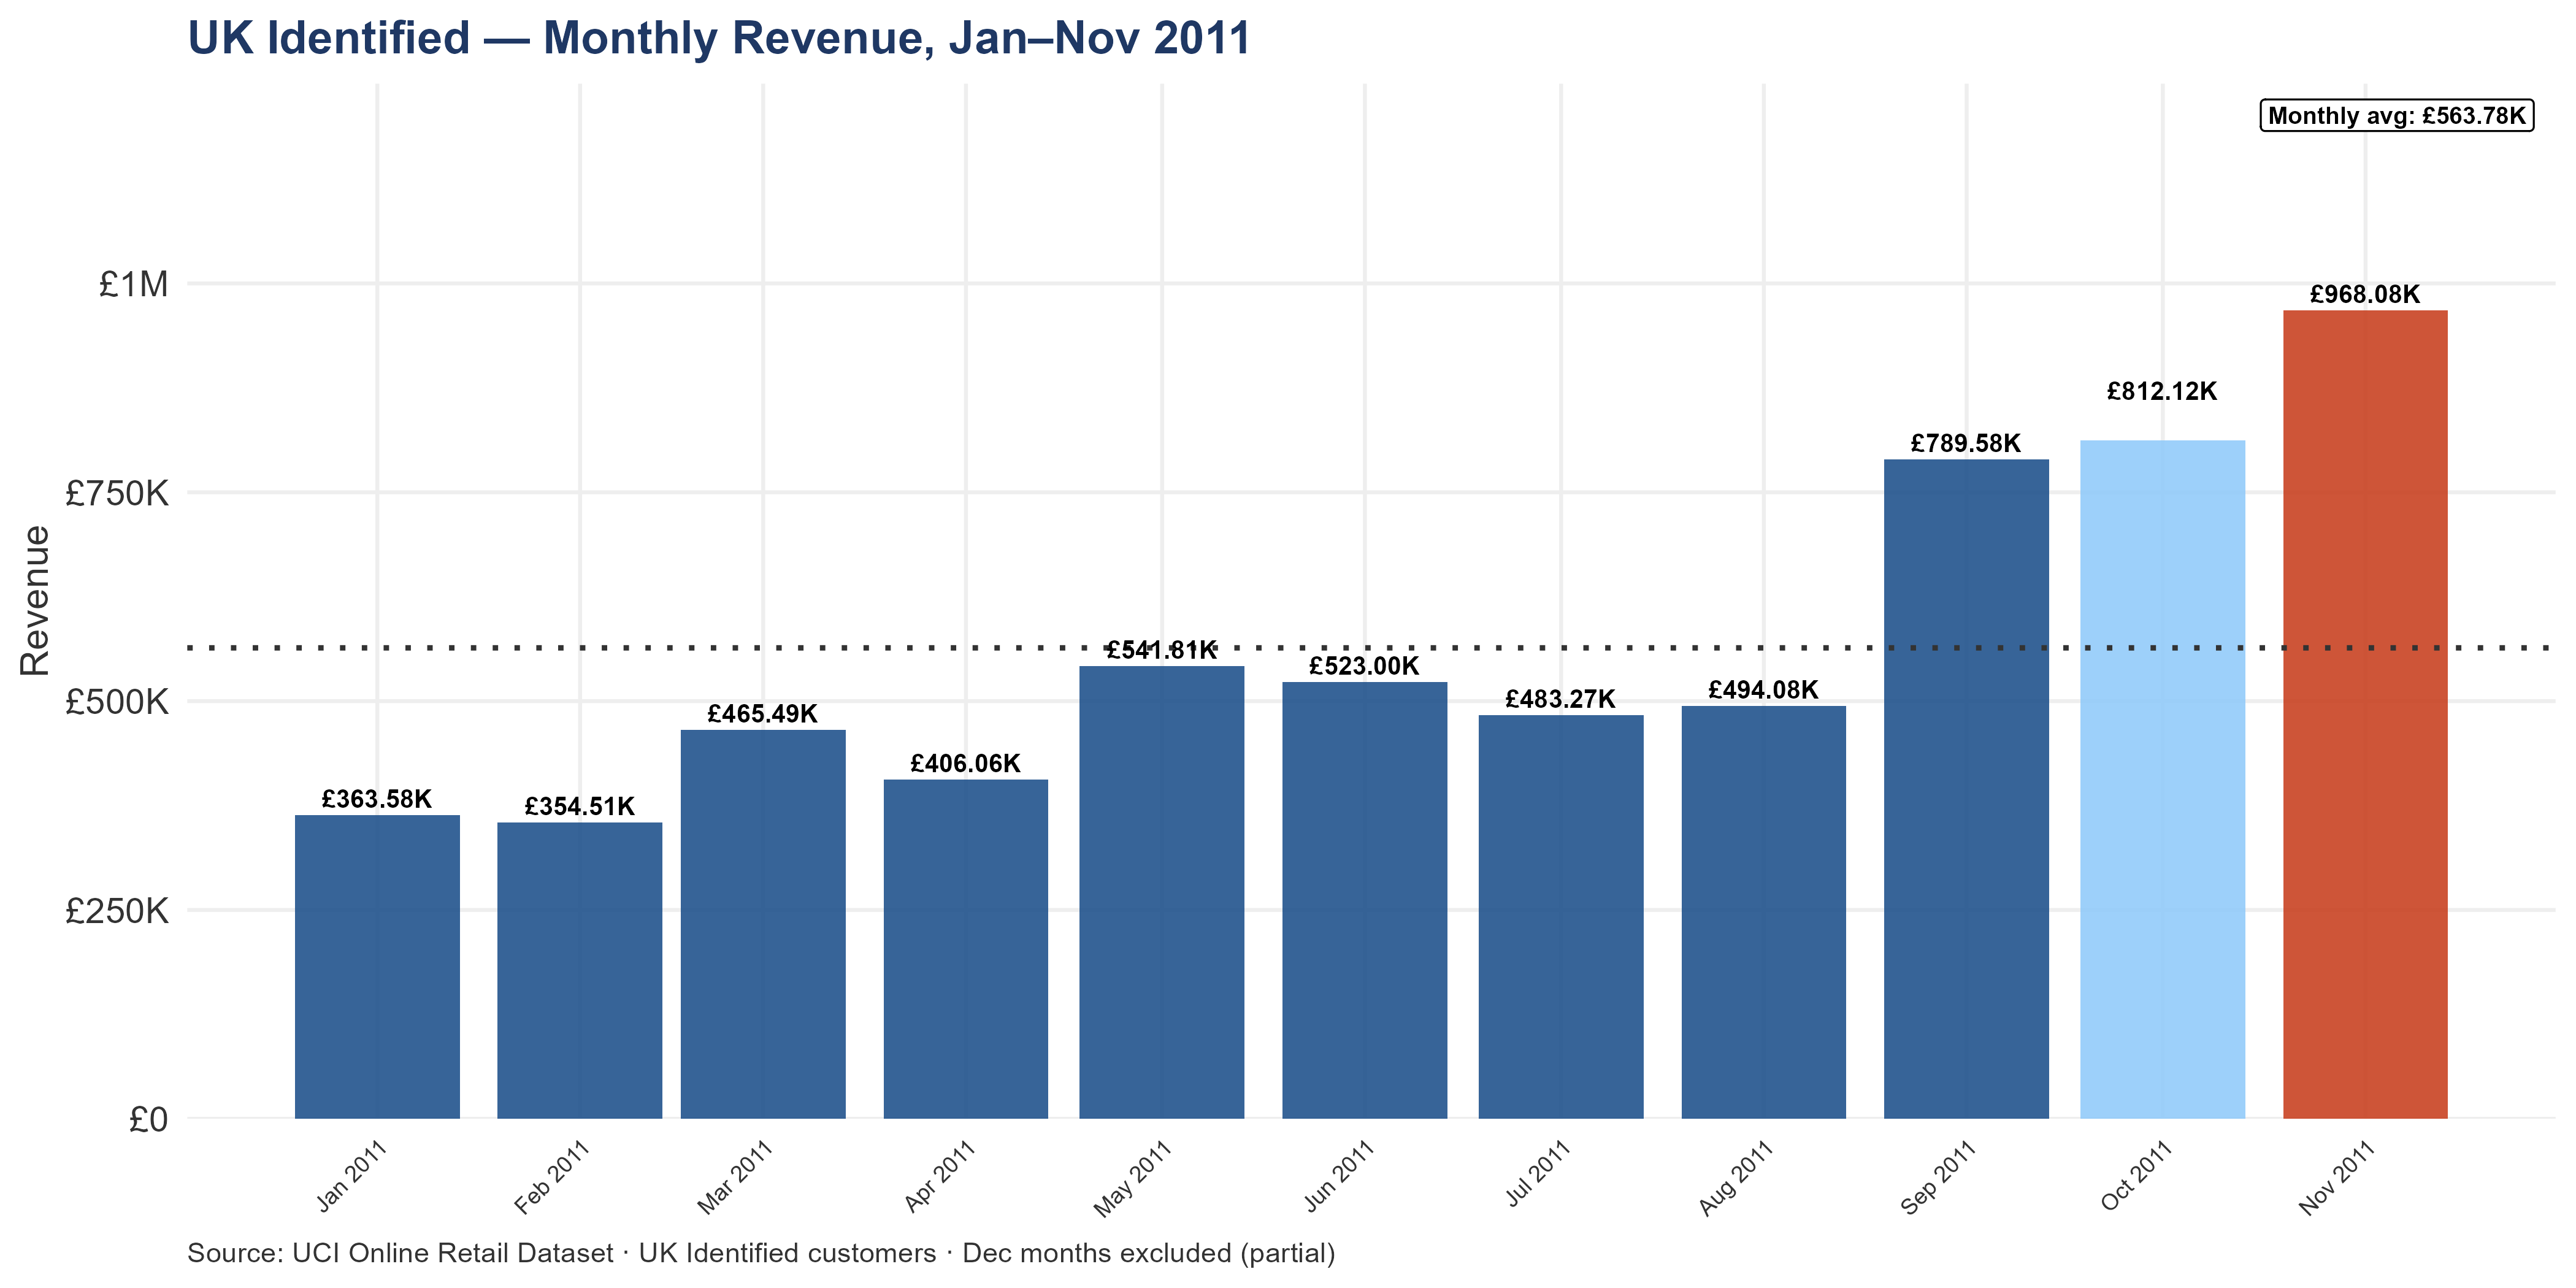
Reading the seasonality pattern. Q4 is the dominant revenue quarter — this is a gift retailer, so Christmas drives the business cycle. The charts show whether revenue concentration in Q4 is getting more or less extreme over time. Increasing Q4 dependence means the business’s annual performance is increasingly determined by a single quarter’s results.
Seasonal percentages in this section (Q4 share, November share, H1/H2 shares) use 2011 calendar-year revenue as the denominator — a slightly different figure from the gross period total (which includes December 2010) and from net revenue after cancellations. All three figures are correct on their own terms; the percentages here use 2011-only revenue for seasonality comparisons.
UK Q4 accounts for 32.00% of annual UK revenue — consistent with the whole-business figure of 33.49%. November is the UK peak month at £968.08K — 14.89% of annual UK revenue in a single month. The UK segment’s seasonal pattern closely mirrors the whole-business pattern.
Q3 (July–September) generated 27.17% of annual UK revenue — £1.77M. Q3 is not a revenue period. It is the preparation window. Every inventory decision, supplier negotiation, and staffing adjustment made between July and mid-September determines how much of the November and December demand the business can actually fulfill. Missing the Q3 window — by committing to stock too late, or by under-ordering on high-velocity products — has no recovery mechanism once November begins.
The first half of the year (January–June) generated 40.82% of annual UK revenue — £2.65M. H1 and H2 are not symmetric: Q4 falls in H2. That asymmetry is why an account that goes silent between H1 and H2 is not experiencing a seasonal pause — it is going quiet precisely when the business needs it to be active. The 687 accounts that lapsed in H2 are identified in Wallet & Momentum.
UK Q4 concentration means the first full trading period under new ownership is also the highest-stakes one. Any integration disruption, team transition, or system change attempted between August and November will directly impact the majority of UK annual revenue. For deal timing: close before August to allow a full Q3 for relationship and operational establishment, or after November to inherit the business after Q4 is complete. A September or October close leaves the acquirer managing a complex transition at peak revenue.
An accelerating Tier 1 account (H2 revenue exceeding H1) is a positive signal — but it also means H2 revenue has become load-bearing. If one of these accounts reverses course in Q1 2012, the revenue drop is concentrated and sudden.
4.3.1 UK Revenue Concentration
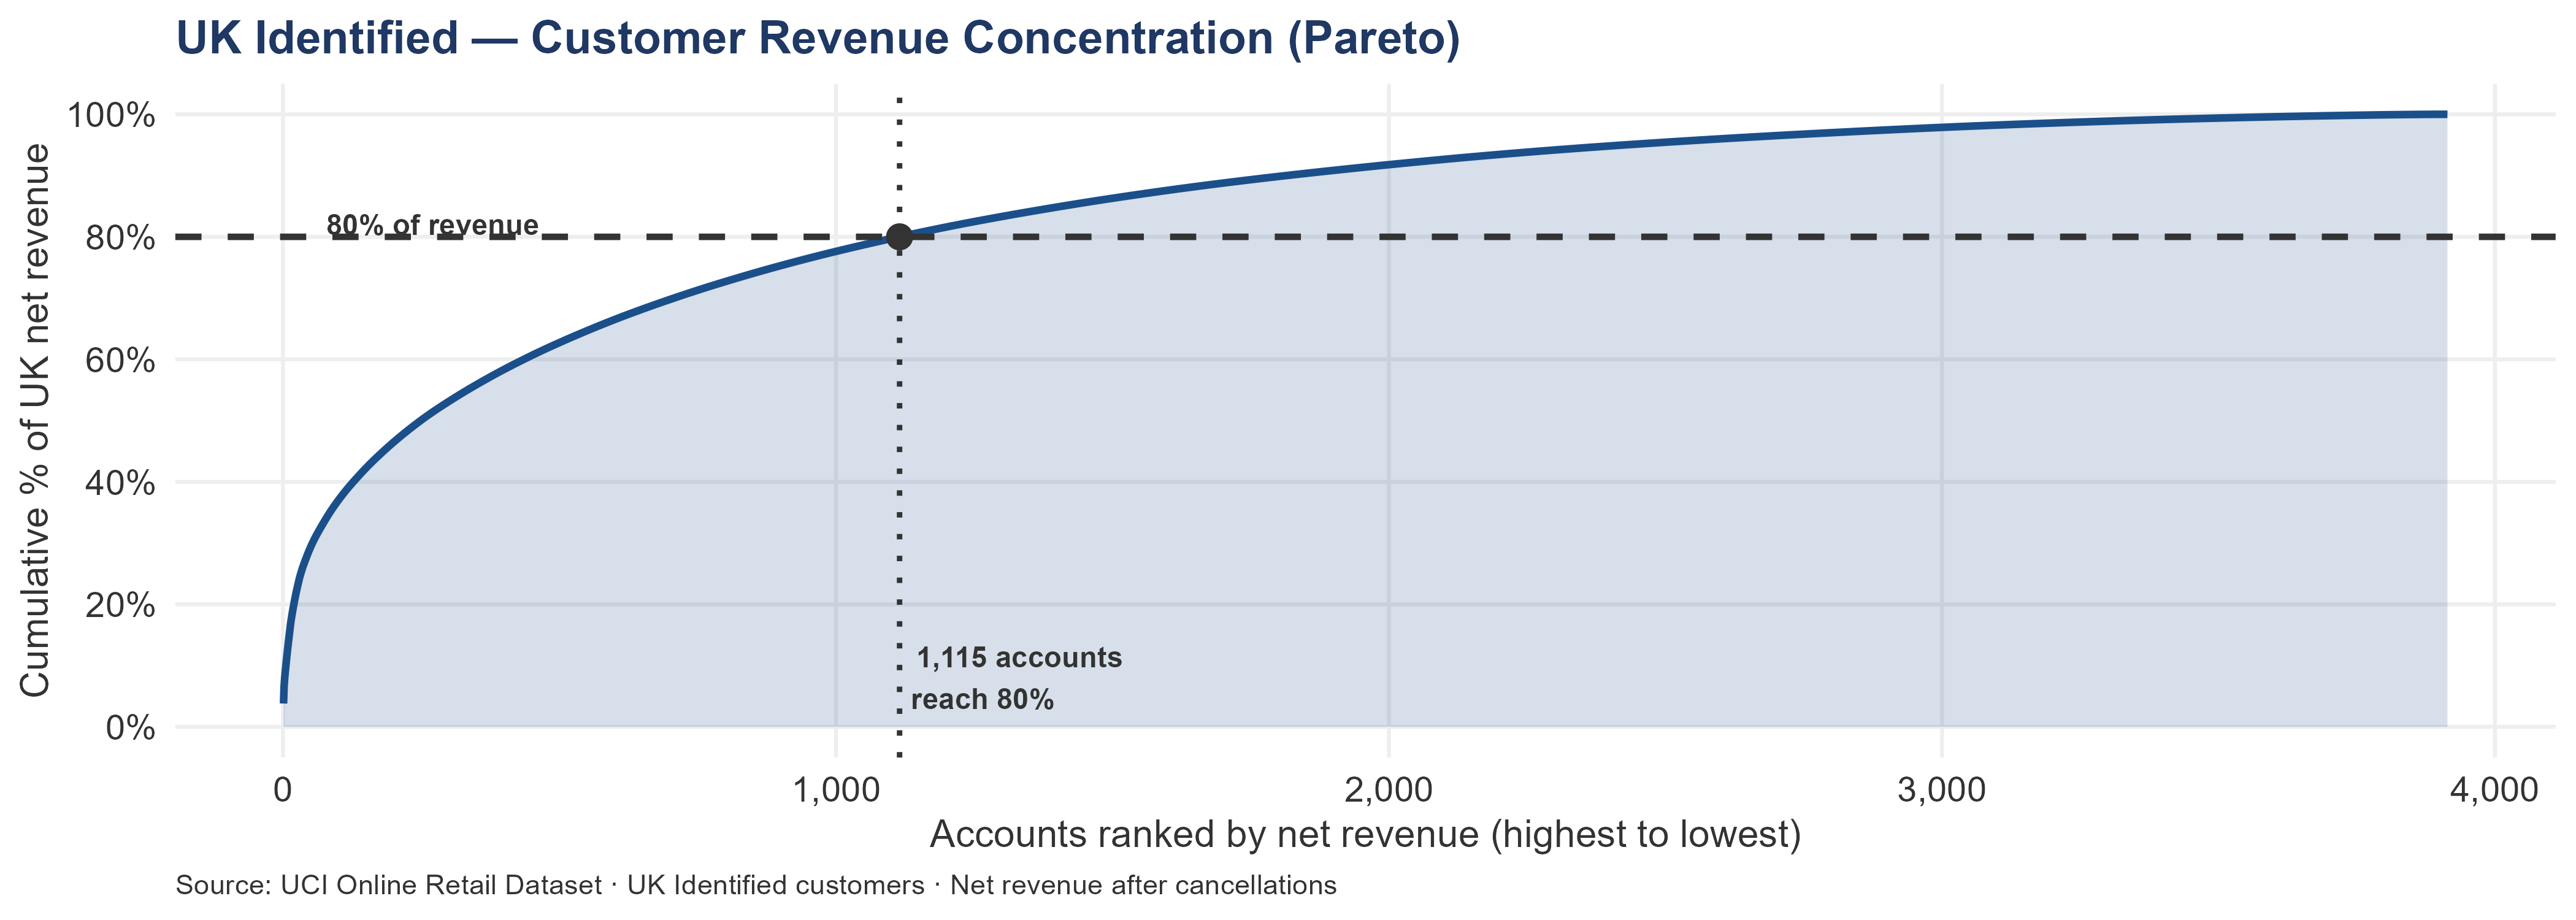
The top 10 UK accounts generate 13.97% of all UK Identified net revenue. It takes 1,115 accounts — 28.49% of the UK base — to reach 80% of revenue. The remaining 2,799 accounts together generate the final 20%.
The Pareto curve rises gradually rather than in a sharp step — revenue is distributed across a broad account base rather than locked up in a handful of relationships. This is the structural signature of a wholesale business where no single account loss is an existential event. The curve’s shape also sets the management model: the top 28% of accounts by revenue warrant disproportionate attention, but the long tail still contributes 20% of segment revenue and cannot be ignored entirely.
UK concentration is healthy by wholesale standards. The full concentration analysis — including the international comparison, SKU-level concentration, and single-point-of-failure assessment — is in Revenue Concentration Risk.
4.3.2 Account Acquisition by Quarter
| Acquisition Quarter | Accounts | Total Net Revenue | Median Rev / Account |
|---|---|---|---|
| Q4 2010 | 814 | £3.48M | £1.52K |
| Q1 2011 | 1,115 | £1.79M | £822 |
| Q2 2011 | 746 | £722.70K | £577 |
| Q3 2011 | 585 | £469.23K | £482 |
| Q4 2011 | 654 | £339.03K | £325 |
UK account acquisition fell from 1,115 in Q1 2011 to 585 in Q3 — a 47.5% drop. More importantly, the median revenue per acquired account fell from £822 to £482 over the same period — a 41.3% drop. The Q3 cohort is generating less revenue per account than any prior cohort in the dataset. Whether this reflects shorter observation time (Q3 customers had fewer months to accumulate revenue) or genuine quality decline cannot be confirmed from one year of data — but the combined pattern (smaller cohorts AND lower median revenue per cohort) is consistent with quality decline, not just observation truncation. Identifying what was different about Q1 2011 — channel, promotion, or campaign — is a pre-close DD investigation that informs forward acquisition planning.
4.3.3 Account Tiers by Net Revenue
| Tier | Accounts | Net Revenue | % of UK Rev | Median Rev | At-Risk Accounts |
|---|---|---|---|---|---|
| Tier 1 — Strategic | 10 | £950.74K | 13.97% | £61.67K | 0 |
| Tier 2 — Growth | 40 | £1.05M | 15.40% | £23.36K | 3 |
| Tier 3 — Maintenance | 1,308 | £3.45M | 50.74% | £1.92K | 302 |
| Tier 4 — Occasional | 1,204 | £918.61K | 13.49% | £606 | 484 |
| Tier 5 — One-time | 1,352 | £435.45K | 6.40% | £239 | 665 |
4.3.4 Tier 1 — Strategic Accounts (Top 10 by Net Revenue)
| Rank | Customer ID | Net Revenue | Gross Revenue | Cancel Rate | Orders | Last Order | H1→H2 | Status |
|---|---|---|---|---|---|---|---|---|
| 1 | 18102 | £259.66K | £259.66K | 0.00% | 60 | 2011-12-09 | +130% | Accelerating |
| 2 | 17450 | £189.58K | £194.39K | 2.48% | 46 | 2011-12-01 | +129% | Accelerating |
| 3 | 17511 | £88.14K | £91.06K | 3.21% | 31 | 2011-12-07 | +72% | Accelerating |
| 4 | 16684 | £65.92K | £66.65K | 1.10% | 28 | 2011-12-05 | +103% | Accelerating |
| 5 | 13694 | £62.96K | £65.04K | 3.20% | 50 | 2011-12-06 | +7% | Active |
| 6 | 16029 | £60.37K | £72.71K | 16.97% | 62 | 2011-11-01 | +193% | Accelerating |
| 7 | 15311 | £59.28K | £60.63K | 2.22% | 91 | 2011-12-09 | -23% | Active |
| 8 | 13089 | £57.32K | £58.76K | 2.45% | 97 | 2011-12-07 | +29% | Active |
| 9 | 15061 | £54.25K | £54.53K | 0.52% | 48 | 2011-12-06 | +244% | Accelerating |
| 10 | 14096 | £53.26K | £53.26K | 0.00% | 17 | 2011-12-05 | — | Active |
Warning⚠ Account 16029 — Tier 1 with 16.97% Cancellation Rate
Account 16029 ranks #6 in Tier 1 by net revenue (£60.37K net, £72.71K gross) but has a cancellation rate of 16.97% — the highest of any Tier 1 account. Its net revenue figure is already adjusted for cancellations. Before treating this account as a straightforward strategic relationship, investigate: what products are being cancelled, at what rate, and whether the cancellations represent fulfillment issues, price disputes, order entry errors, or normal pre-shipment adjustments. Full account-level cancellation analysis is in the Cancellations chapter.
4.3.5 UK Customer Base Trajectory — H1 vs H2
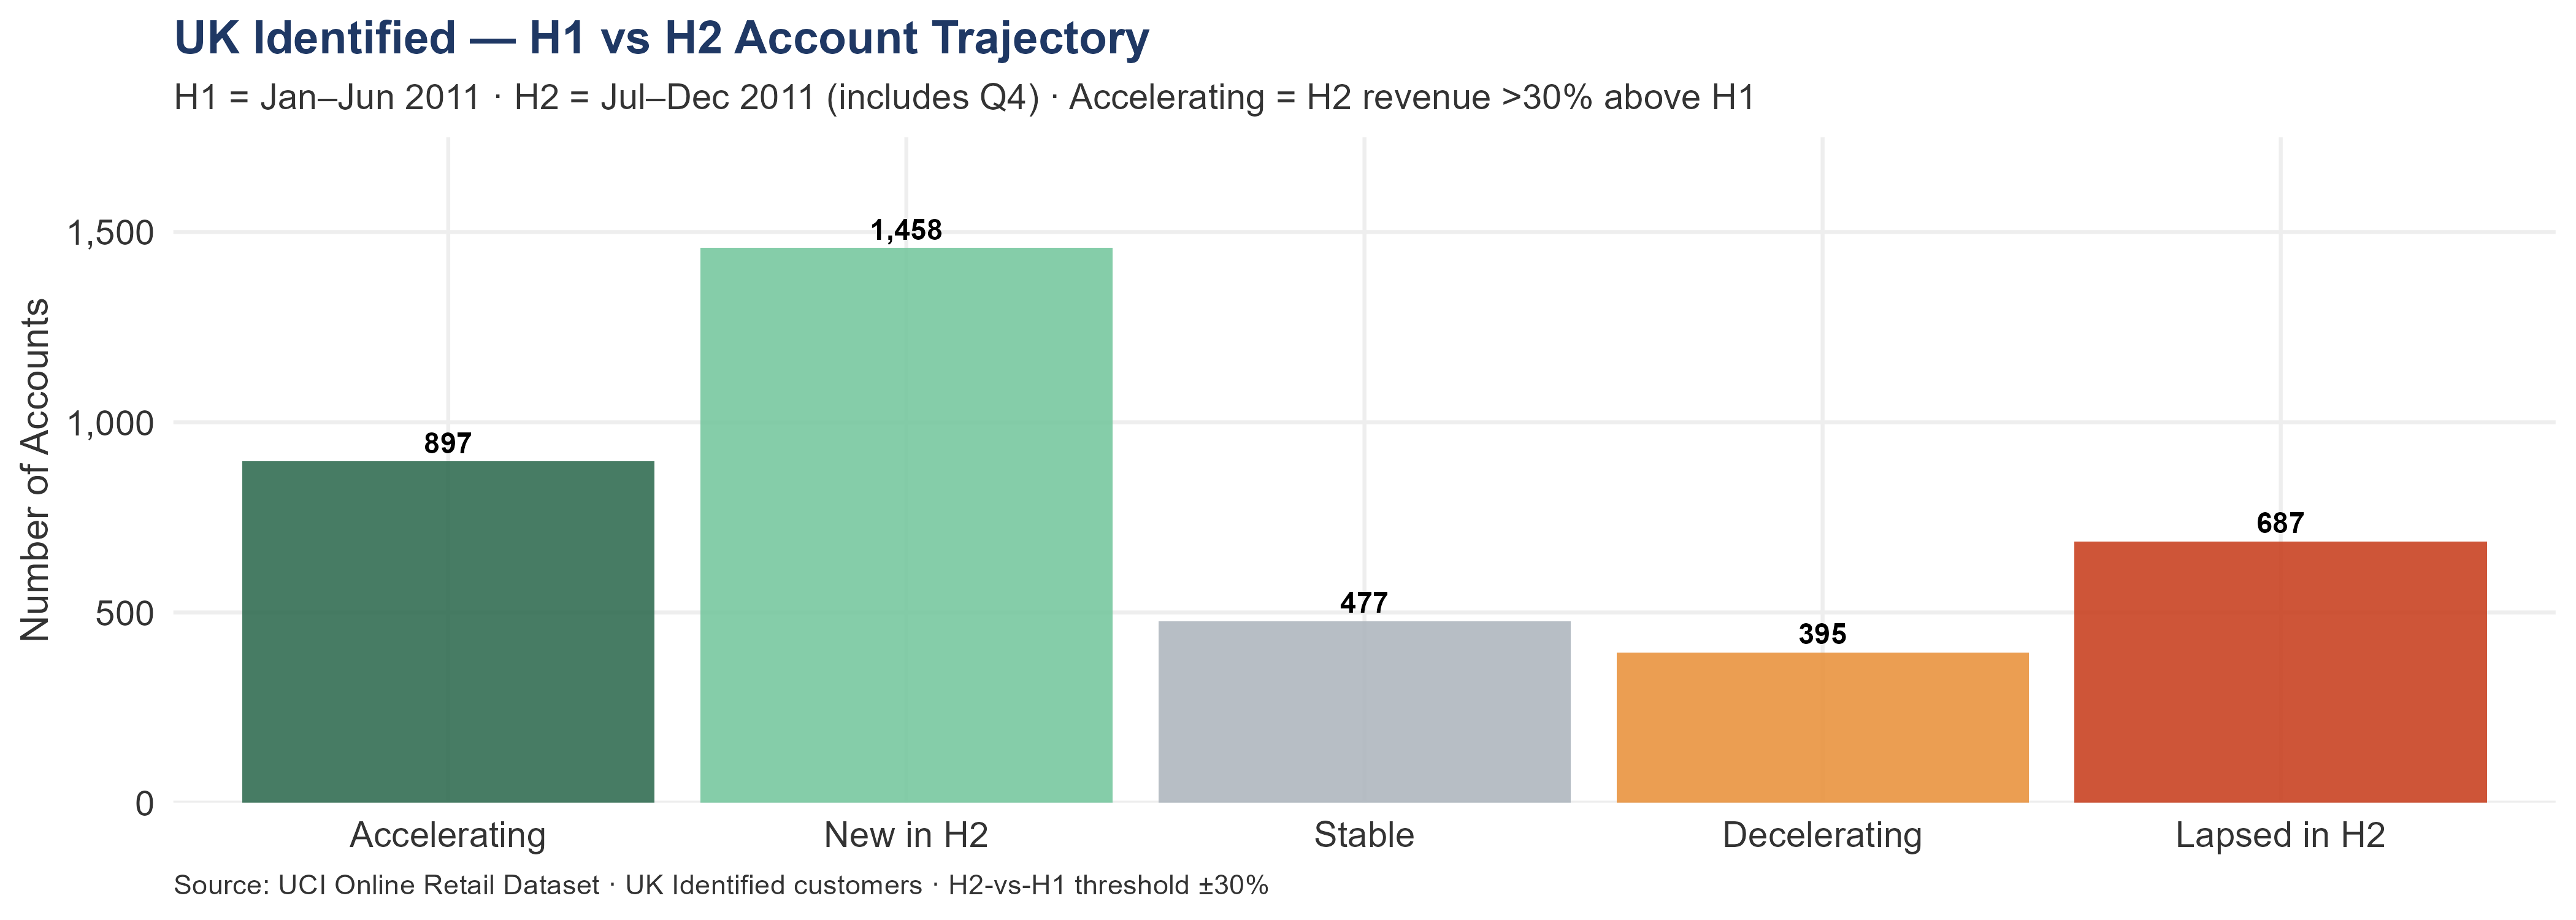
In total, 897 UK accounts accelerated in H2 2011, increasing their revenue by 30% or more relative to H1. Their combined H2 revenue was £2.37M. A further 395 decelerated — spending materially less in H2 than H1. Another 477 were stable within ±30% of their H1 baseline. Meanwhile, 1,458 accounts placed their first order in H2, and 687 that had ordered in H1 placed zero orders in H2.
More accounts are accelerating (897) than decelerating (395). The UK base, in aggregate, is gaining ground from H1 to H2 — a positive structural signal, though it does not offset the 687 relationships that disappeared before Q4 arrived.
The 687 accounts that lapsed in H2 are the most urgent signal in this section. They had an established purchasing pattern in H1 — combined H1 revenue of £353.23K — and then went completely quiet. This did not happen in January or February, when silence might reflect a seasonal pause. It happened in the second half of the year, including the months immediately before Q4. These accounts should have been placing their largest orders of the year. Instead, they placed none. The accounts requiring immediate attention table below identifies the highest-value silent accounts by tier.
The H1→H2 trajectory breakdown answers whether the UK base is structurally growing or contracting. The 687 lapsed H2 accounts are zero-acquisition-cost targets: a reactivation call from new ownership simultaneously attempts to restart the commercial relationship and introduces the change of management. At the UK 3-year LTV (approximately £1.24K per retained customer), reactivating 10% of these accounts adds approximately £85.83K to the forward portfolio at outreach cost only — the highest-ROI first-month action available in the UK segment after the overdue Frequent contacts.
4.4 Accounts That Have Gone Quiet
The grouped view below shows the shape of the silent-account exposure by frequency tier. The UK median reorder interval is 52 days, so an account silent for 90 days has missed at least one full purchasing cycle, and 270 days represents roughly five missed cycles. The full overdue analysis — including the per-tier cadence thresholds and investigation protocols — is in Wallet Share & H1 vs H2 Momentum.
| Tier | Account Count | Combined Net Revenue | Median Days Silent | Investigation Priority |
|---|---|---|---|---|
| Frequent (10+) | 7 | £23.39K | 156 | Investigate first — established cadence broken |
| Regular (4–9) | 125 | £192.75K | 127 | Investigate — relationship interruption |
| Occasional (2–3) | 406 | £330.26K | 172 | Reactivation pool — sized for bulk outreach |
| One-timer (1) | 762 | £226.09K | 246 | Conversion campaign cohort |
4.5 Accounts Active in 2010 but Silent in 2011
These customers ordered in 2010 and placed nothing in 2011. They are not cold prospects — each has a completed transaction history with this business. A reactivation conversation starts from a fundamentally different position than a cold call.
| Tier | Account Count | Combined 2010 Revenue | Reactivation Priority |
|---|---|---|---|
| Frequent (10+) | 1 | £5.39K | Investigate first — highest documented recurring value lost |
| Occasional (2–3) | 7 | £4.22K | Reactivation pool — bulk contact program |
| One-timer (1) | 100 | £26.72K | Cold-cohort campaign — limited reactivation evidence |
108 UK accounts ordered in 2010 but placed no orders in 2011. Combined 2010 revenue: £36.33K. This revenue did not transfer to 2011 — it left the segment entirely. Some of these accounts will have closed. Some will have moved their purchasing to a competitor. Some may have experienced a fulfillment or service issue that was never resolved. The transaction record cannot distinguish between these scenarios — that is a pre-close DD investigation. An acquirer would size this exposure against the cost of acquiring an equivalent new account before assigning forward weight.
4.5.1 Summary
The UK account landscape analysis quantifies four exposures:
1. A total of 8 high-value silent accounts (£5K+ net revenue, 90+ days silent). At the UK median reorder interval of 52 days, each has missed at least one full purchasing cycle. The exposure compounds with every additional day of silence.
2. A further 171 mid-value silent accounts (£1K–£5K, 90+ days silent). Smaller individual exposures but collectively material across the segment.
3. The 10 Tier 1 accounts — the segment’s revenue backbone. Of these, 6 are accelerating into H2, which is commercially positive but also concentrates more revenue on those accounts. Q4 purchasing continuity for these accounts is a load-bearing assumption in any forward model.
4. The day-30 conversion gap continues to size daily. New UK accounts that placed their first order in the last 30 days are in their highest-conversion window. The transaction record shows no follow-up signal. Each unrecovered first-order customer represents a permanent deduction from forward portfolio value.
Author: Shawn Phillips | Lailara LLC
← Customer Segmentation | International Customer Landscape →