7 Conversion Windows & Reorder Intervals
7.1 The Conversion Window — When New Customers Decide
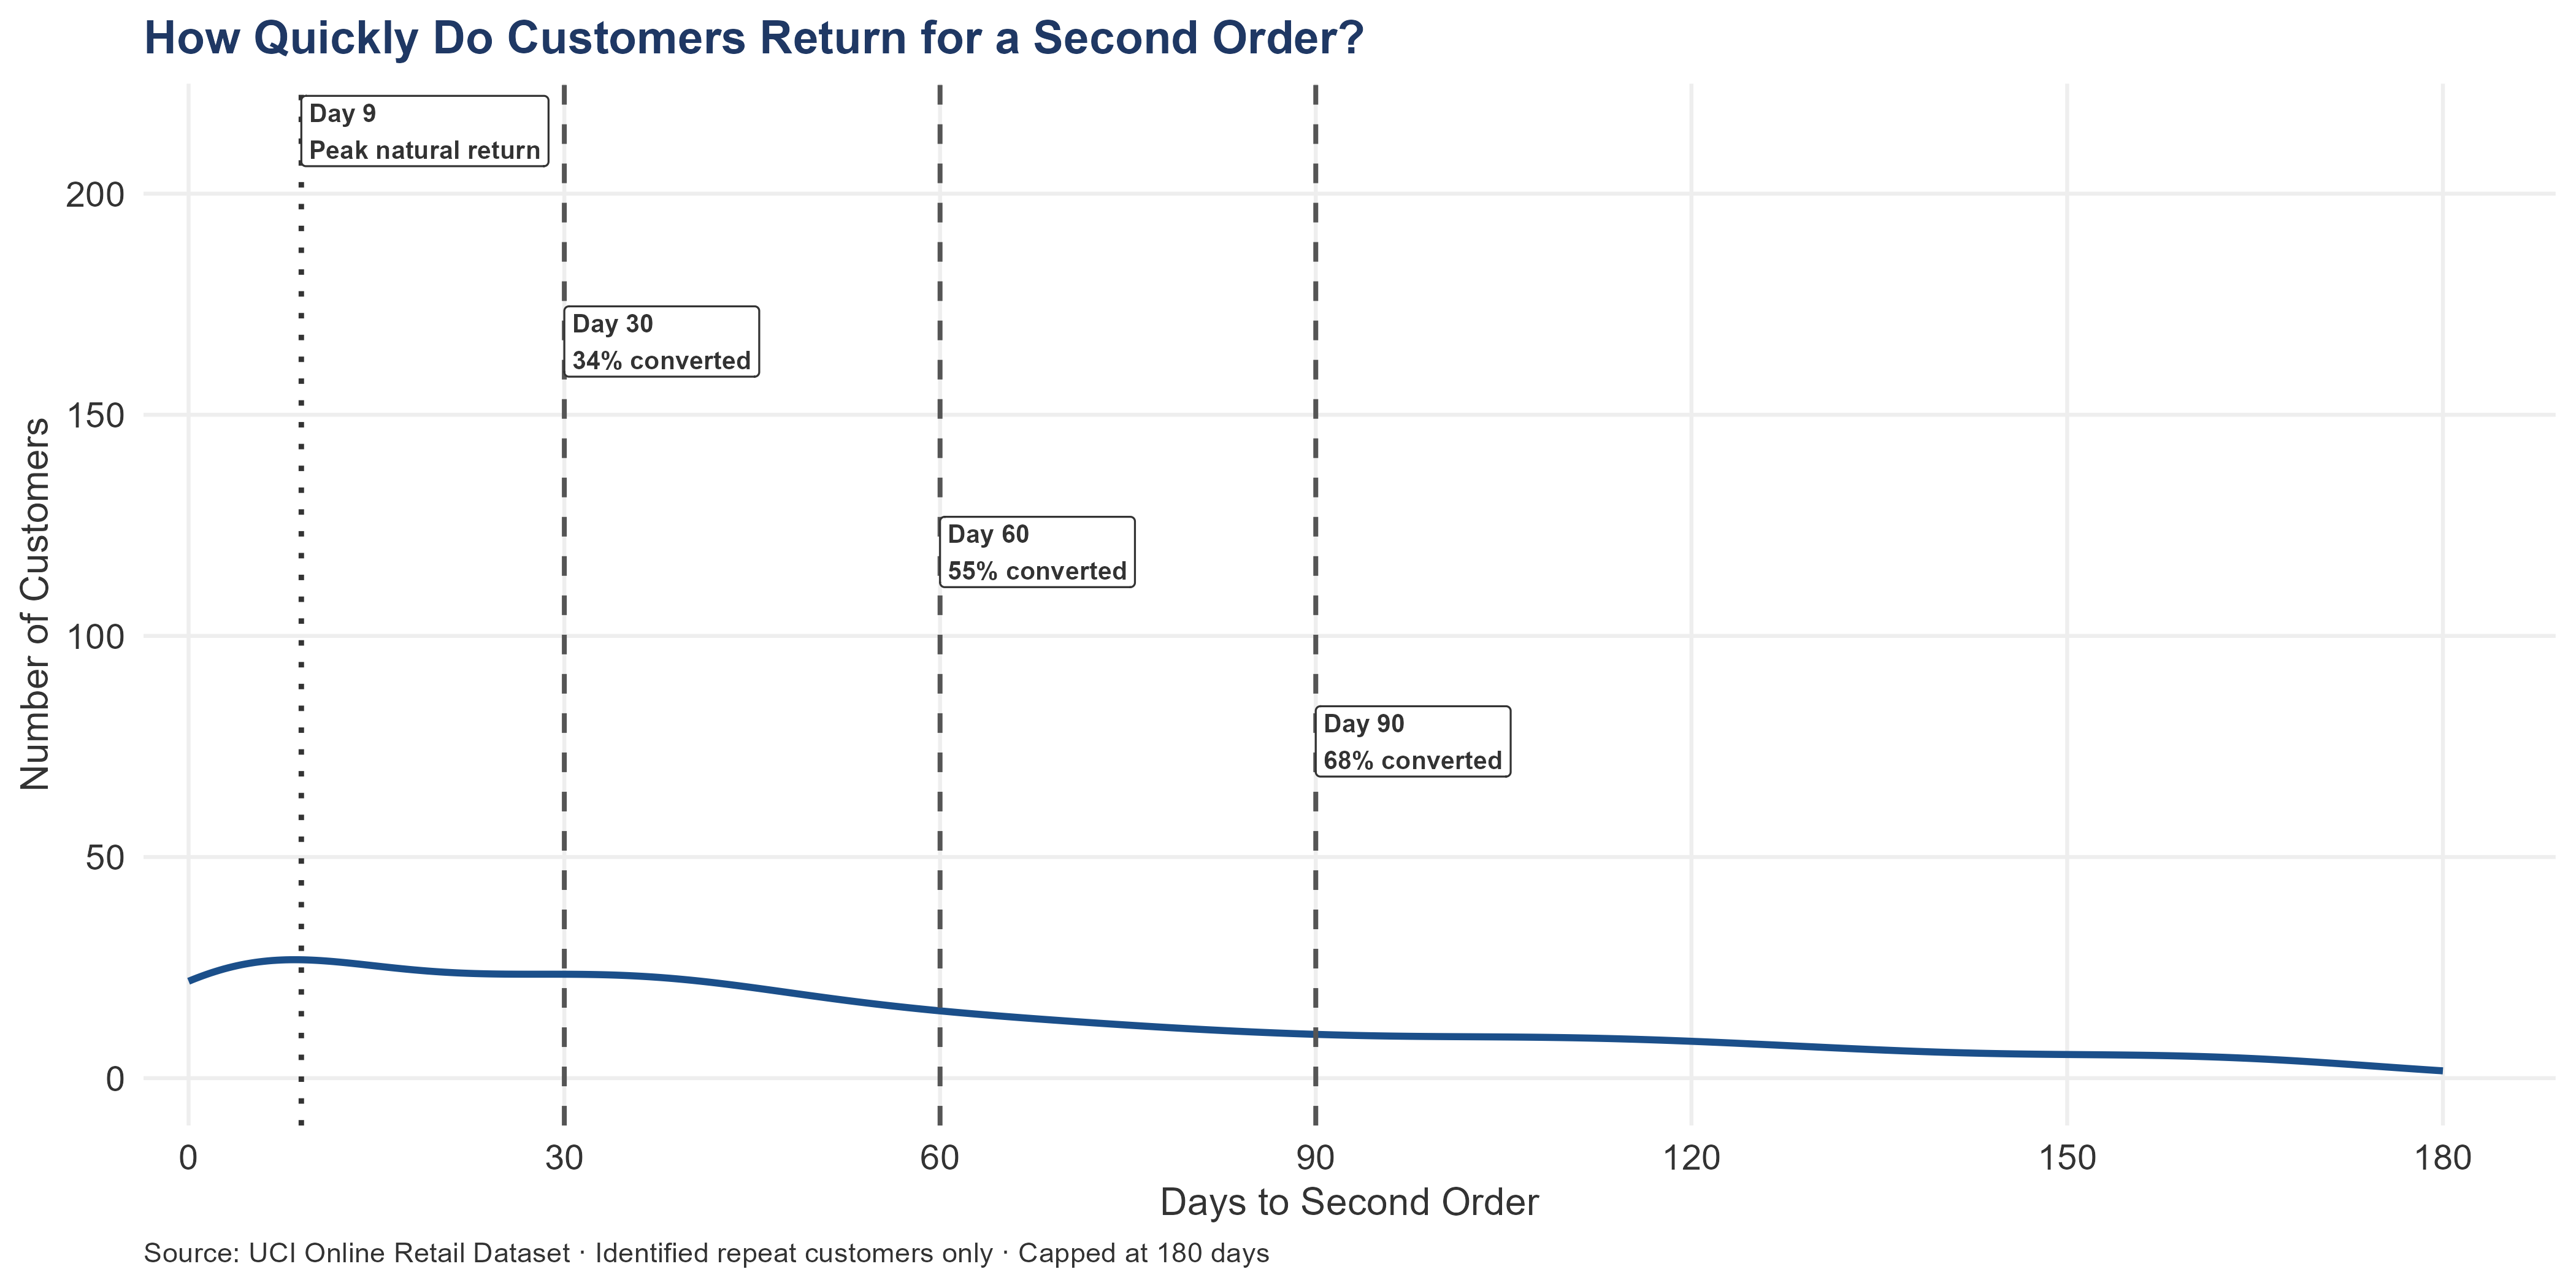
This analysis measures how long it takes customers who eventually place a second order to do so. The population is restricted to known repeat buyers — customers who did return. The question is not whether a customer will convert, but when converters tend to convert.
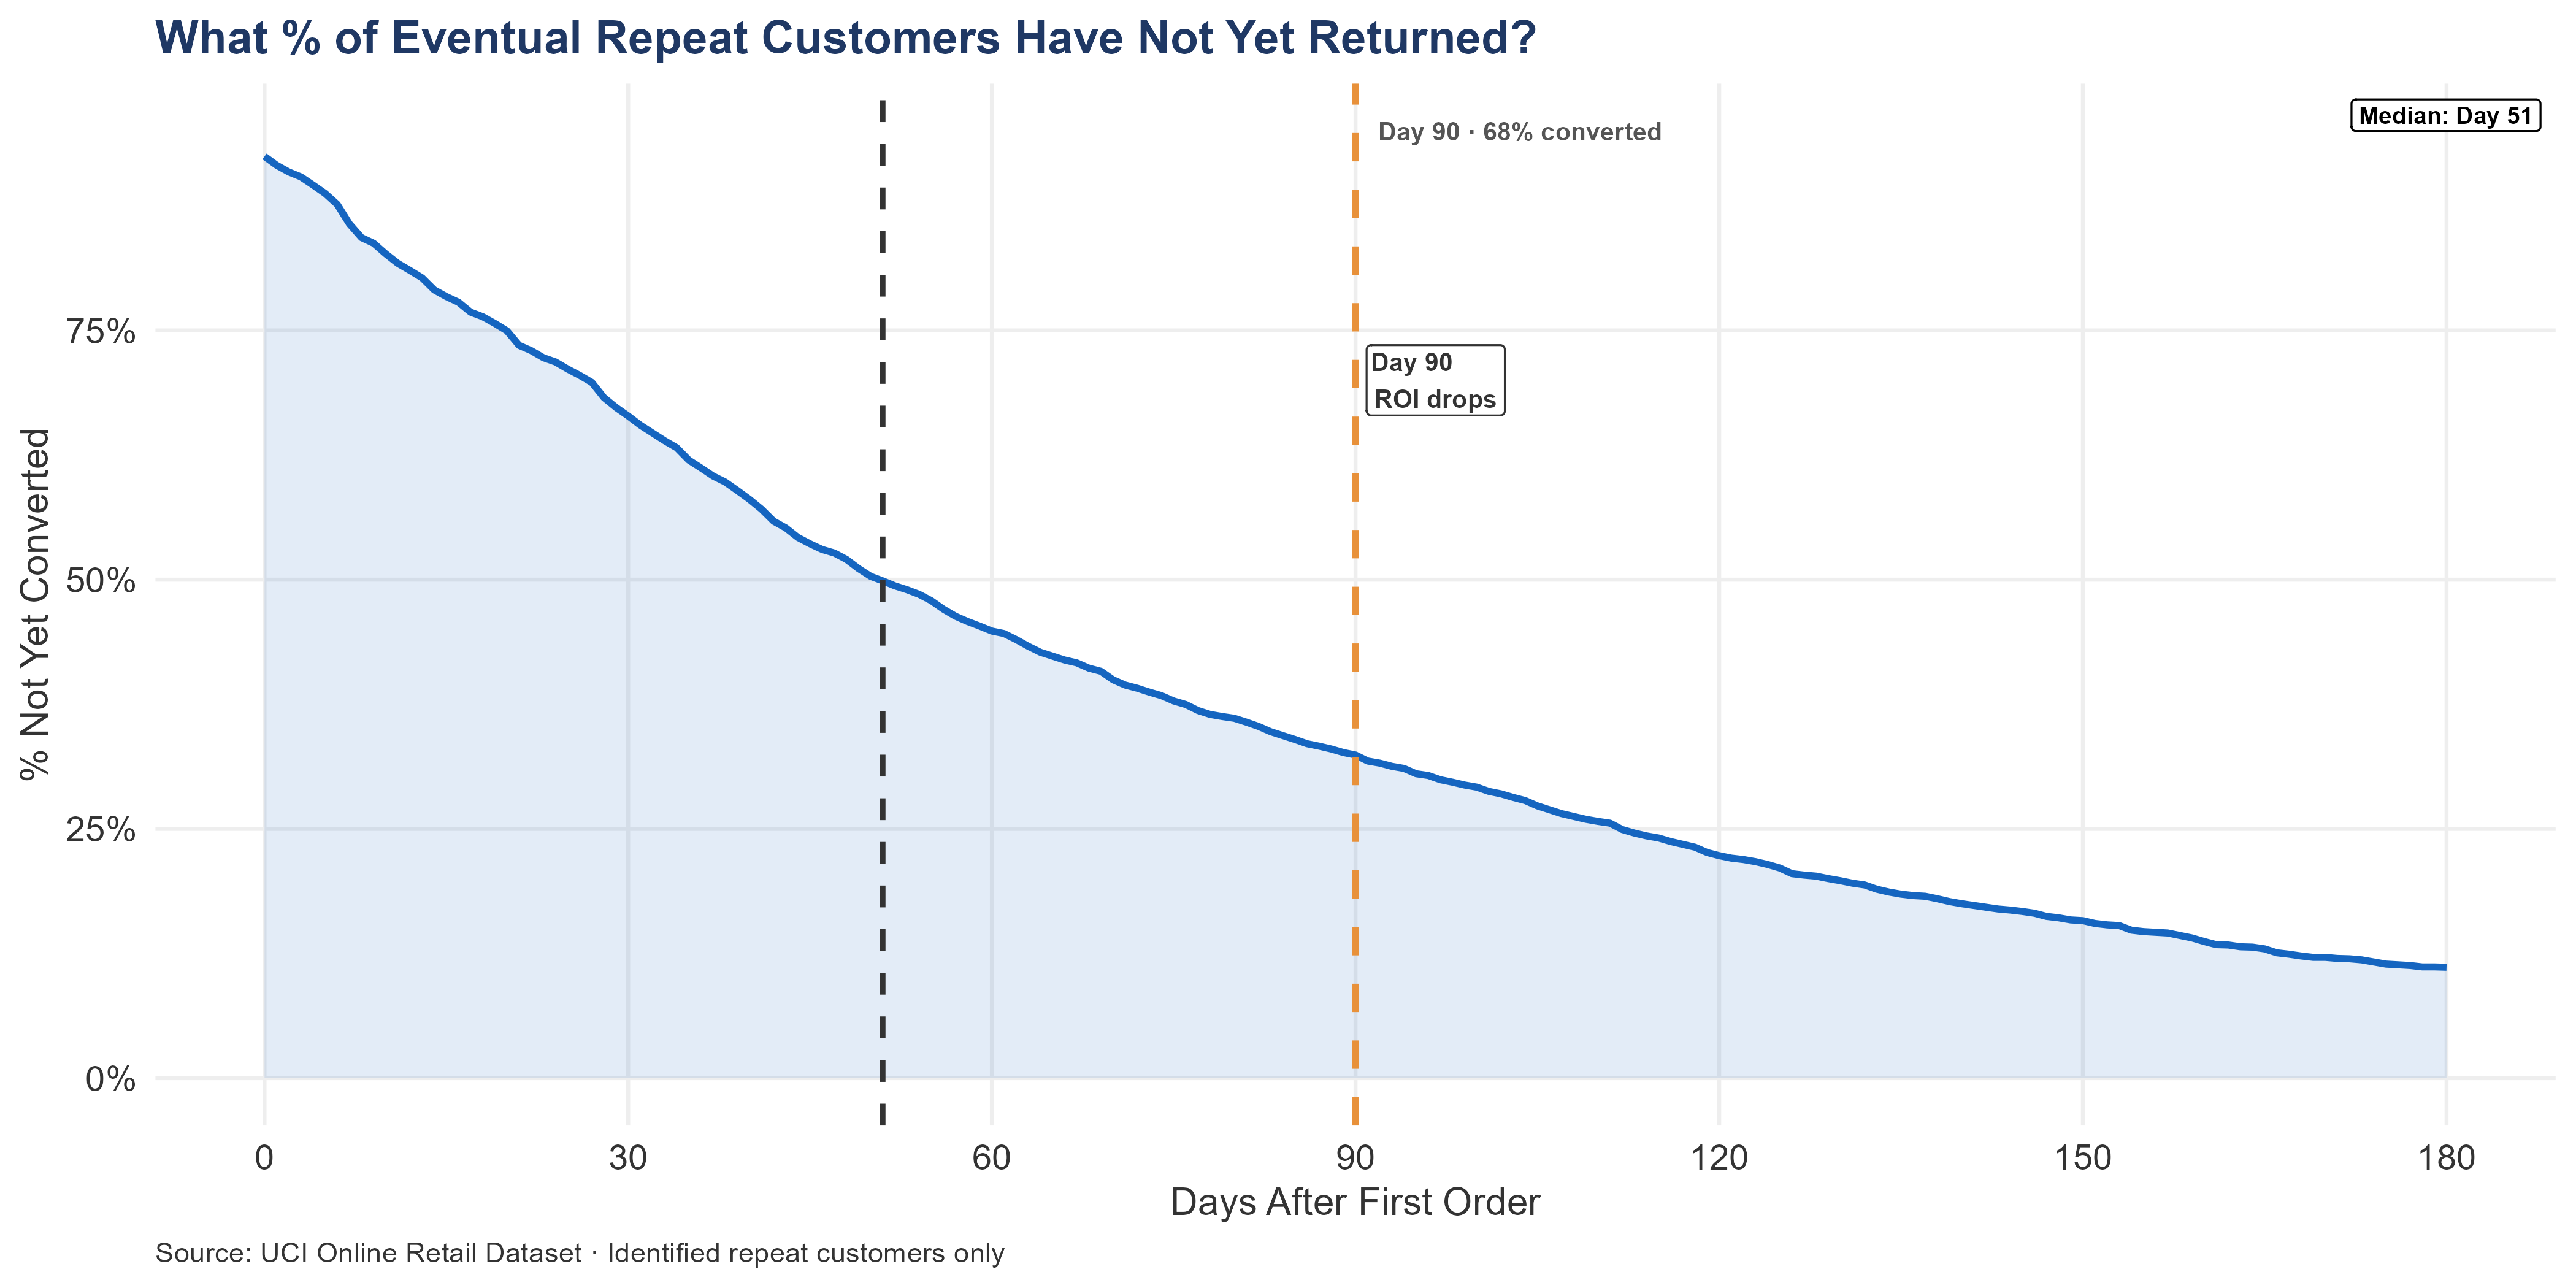
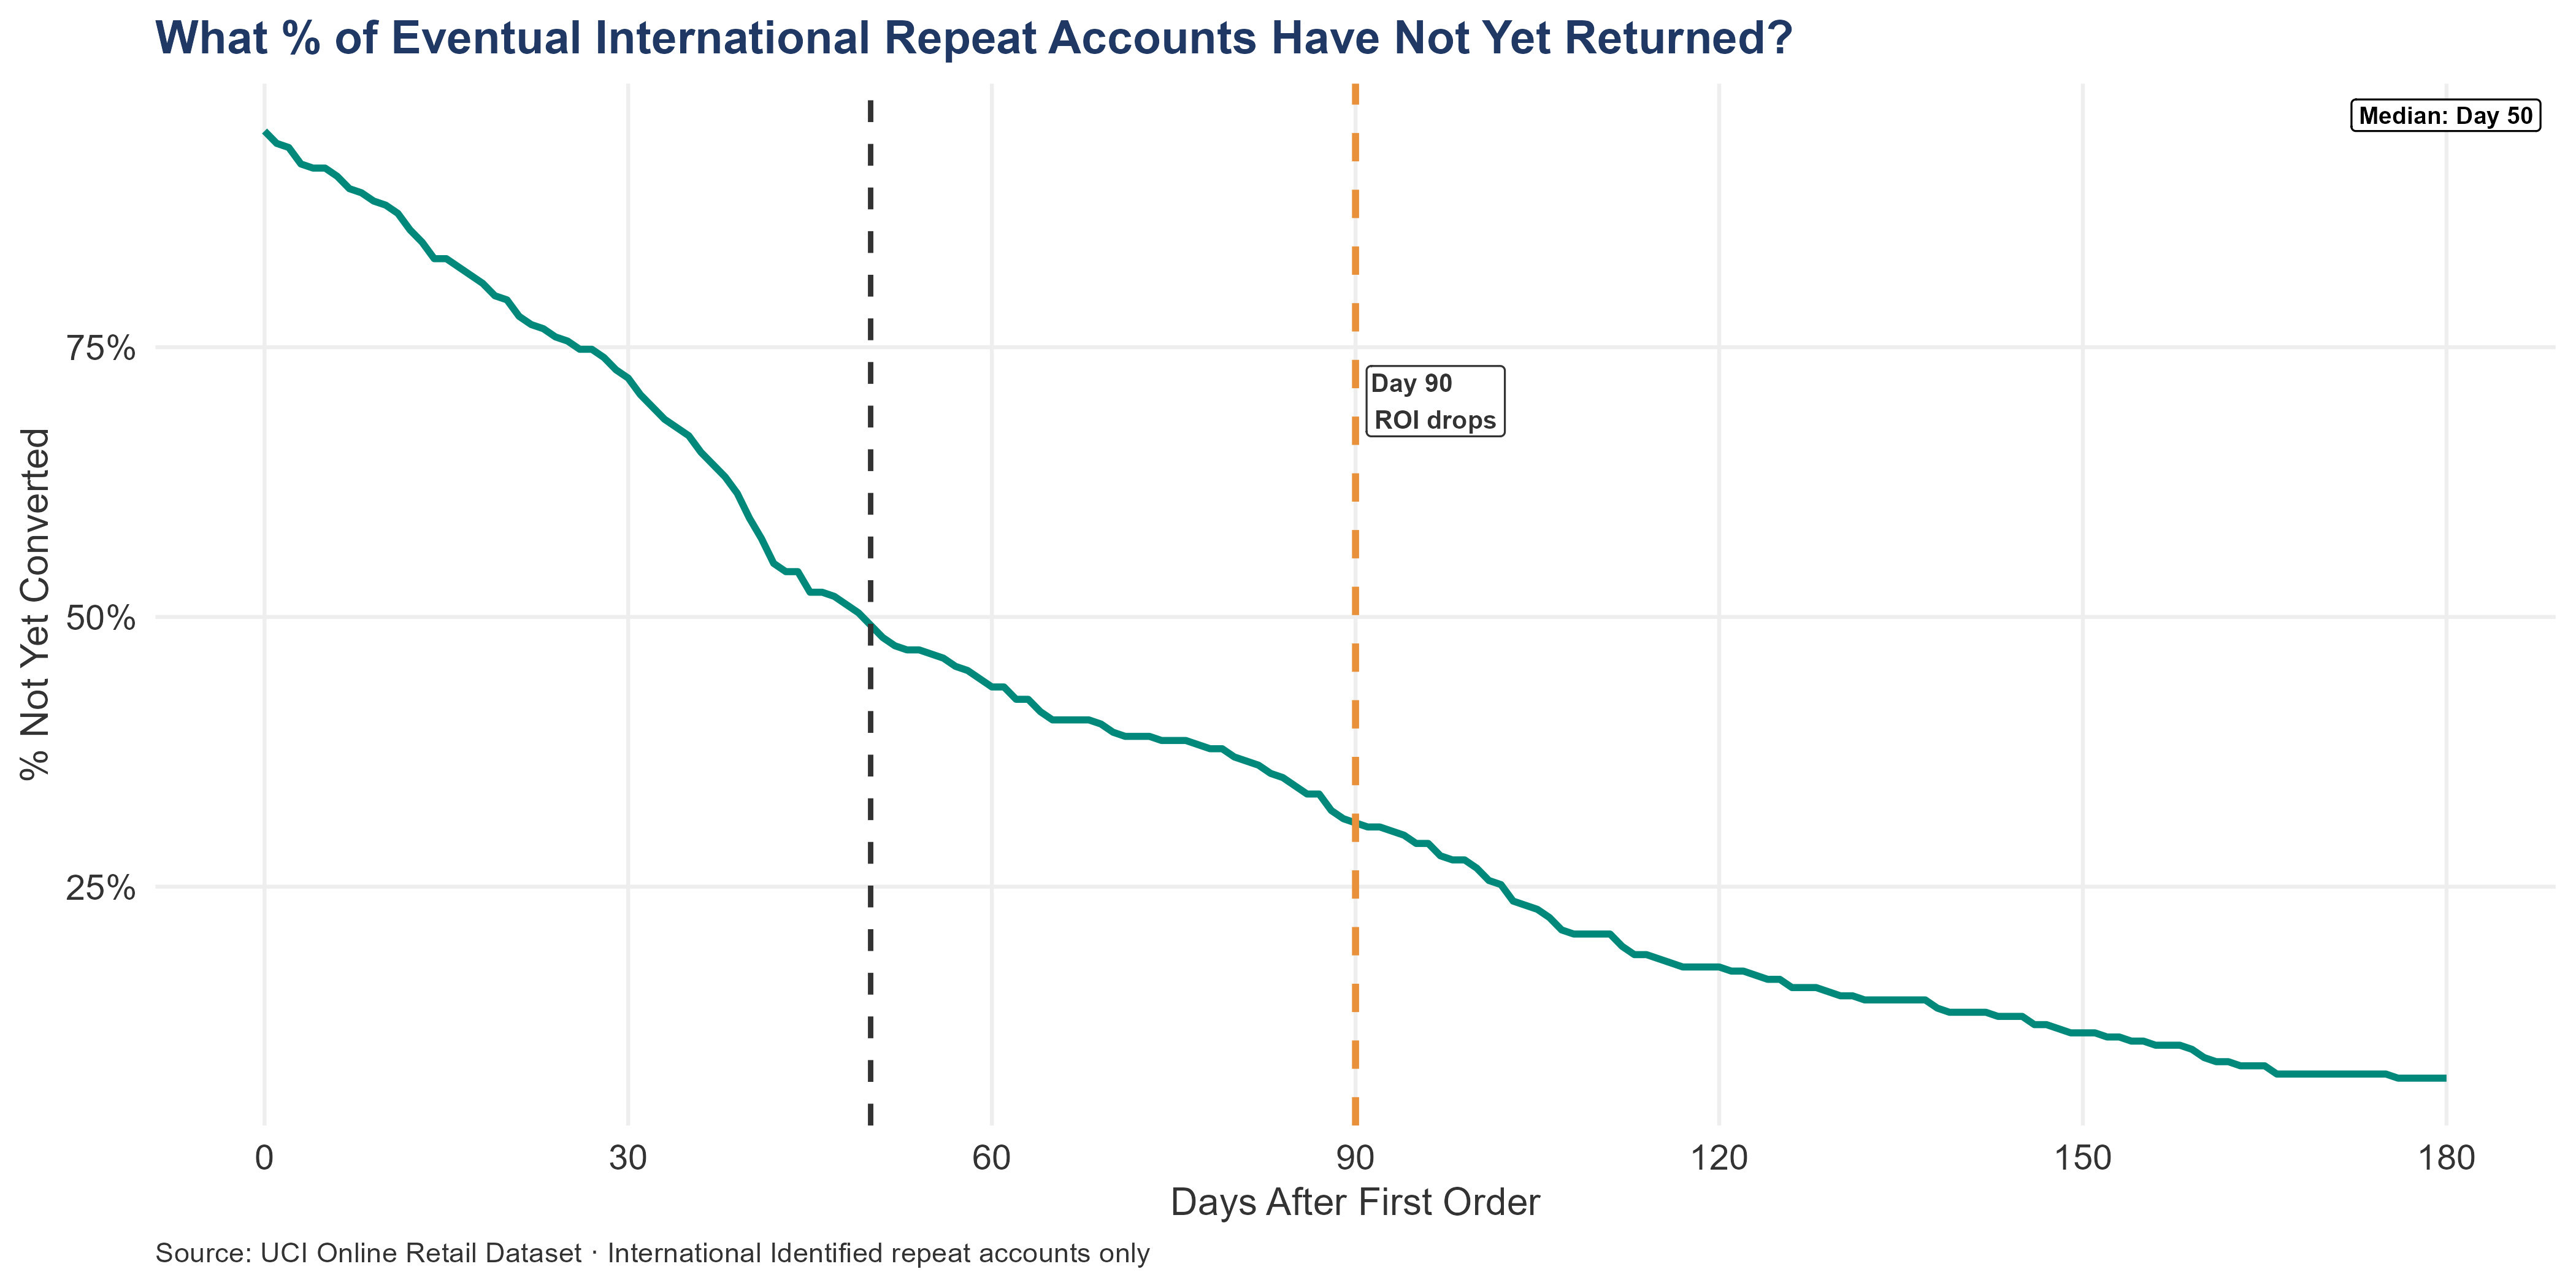
The density distribution identifies the interval at which second orders concentrate most heavily. The survival curve shows it cumulatively — the proportion of eventual converters who have not yet returned by each day. The point at which that curve drops below 25% marks the threshold beyond which outreach reaches a diminishing pool.
7.1.1 The UK Window
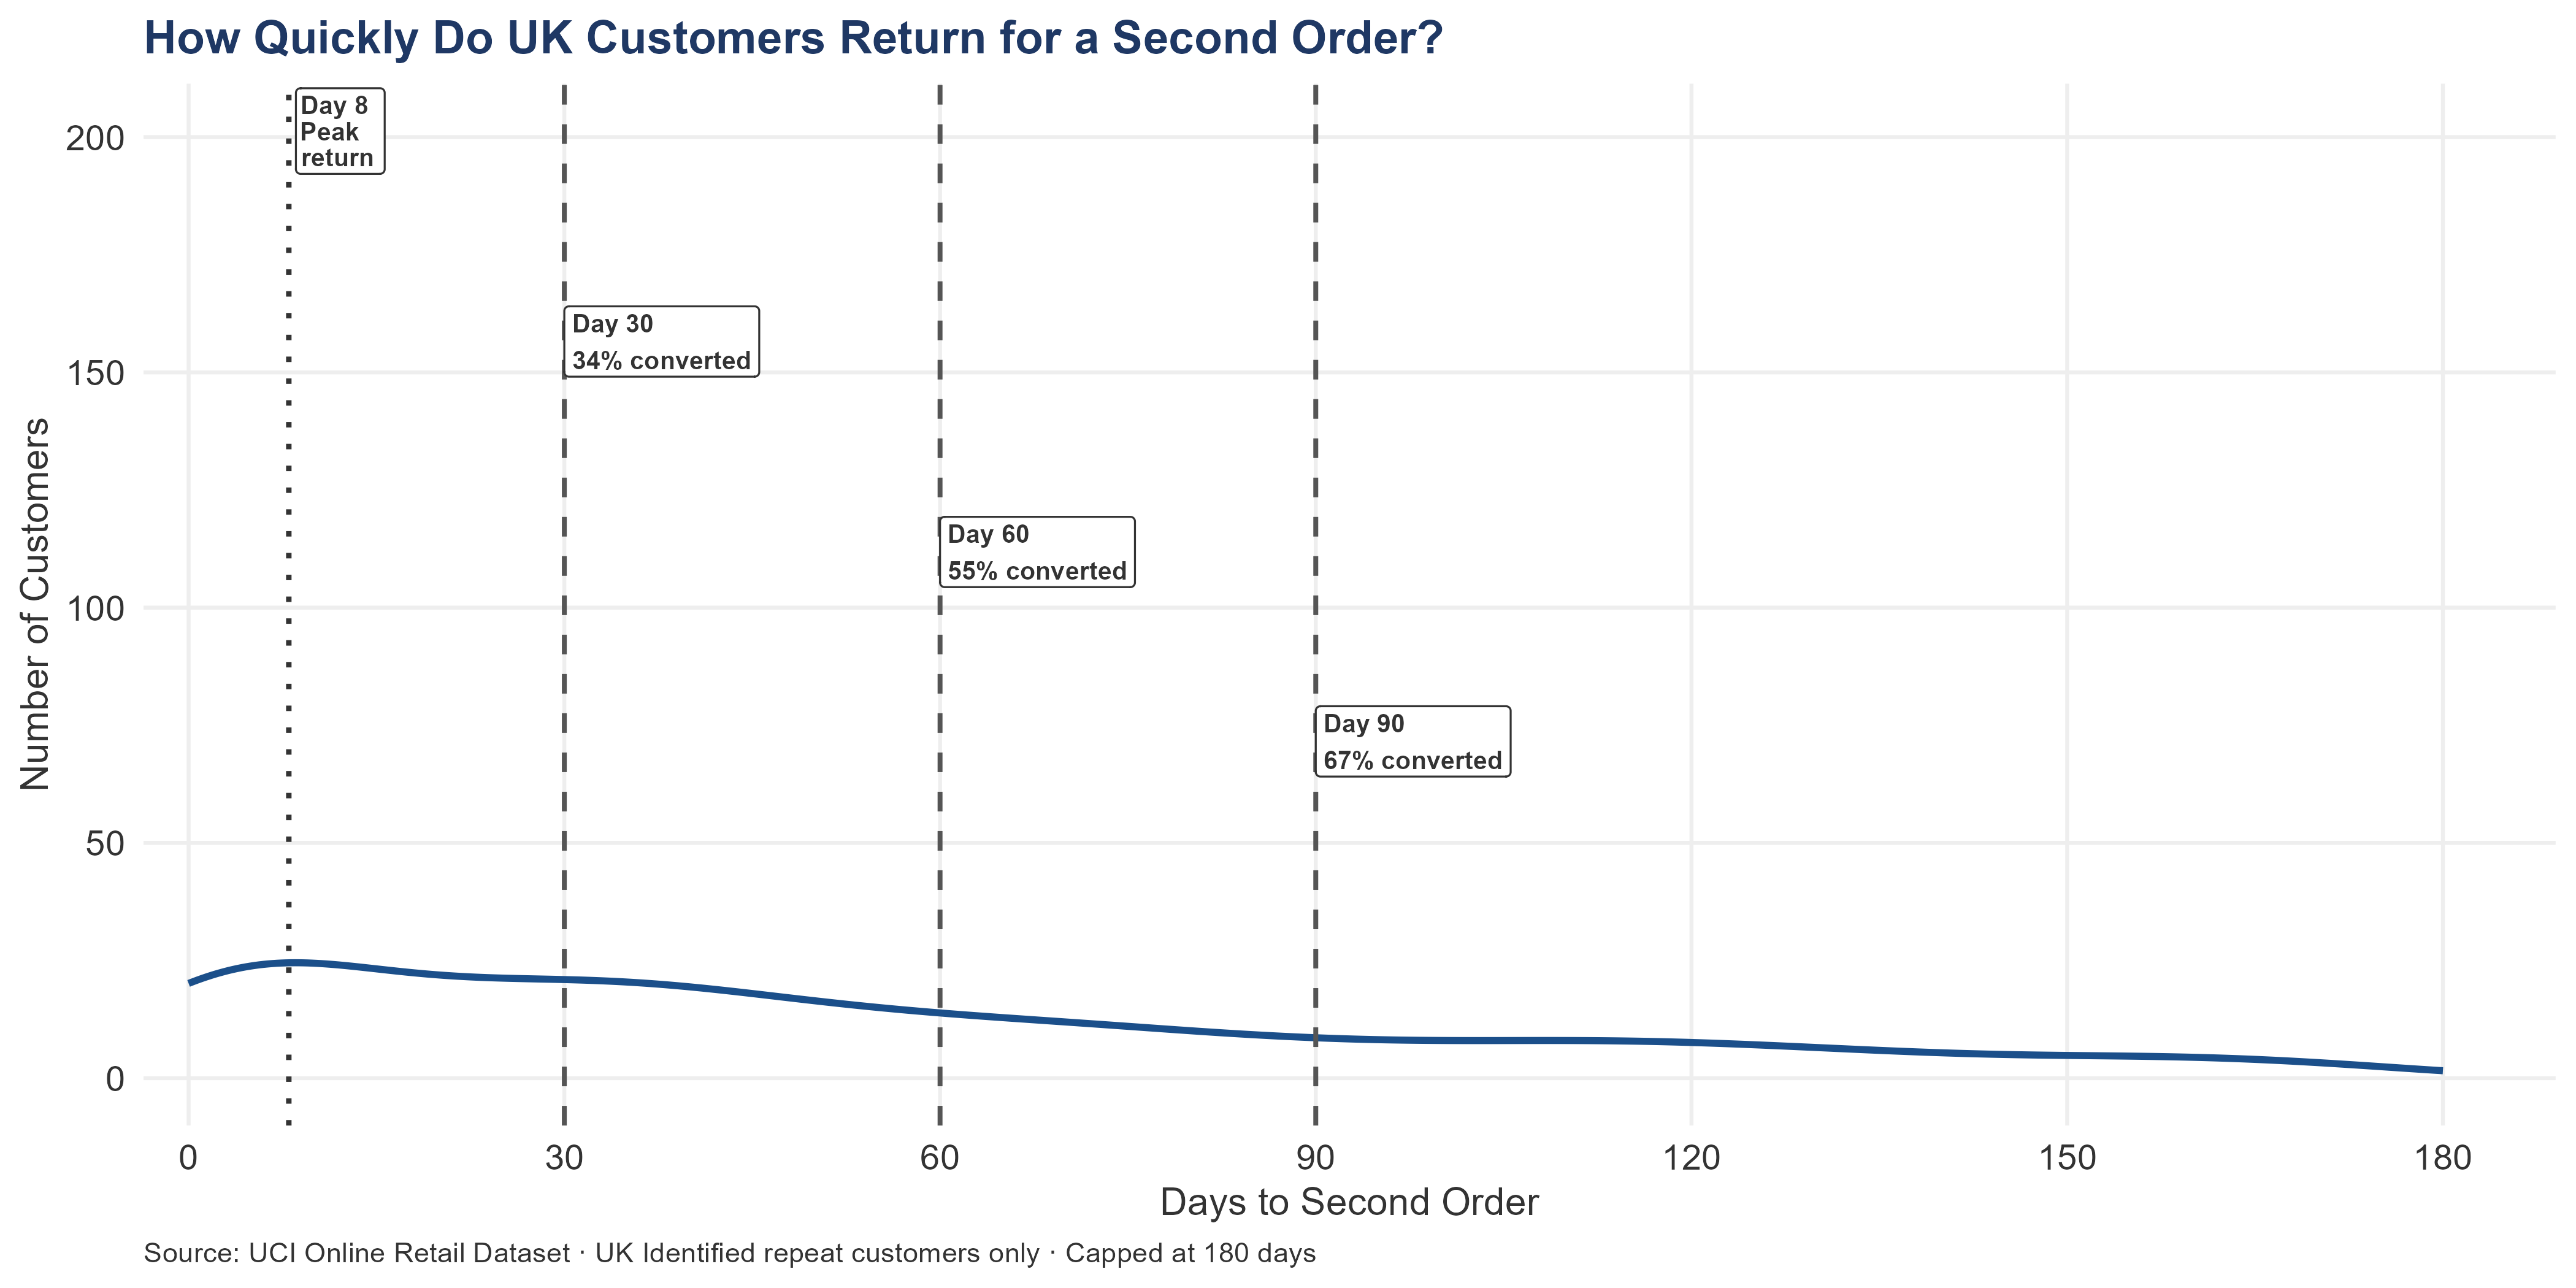
Among UK customers who eventually placed a second order, 34% did so within 30 days of their first purchase. The peak natural return falls on Day 8 — the single interval at which the highest concentration of second orders occurs. By Day 90, 67% have already converted, leaving a third of eventual converters still outstanding.
The peak of the distribution marks the interval where the most customers make their return decision. Beyond it, conversion activity thins progressively.
The median conversion point is Day 52 — half of all eventual converters have placed their second order by then. Beyond Day 90, the remaining pool shrinks to the point where per-contact outreach cost rises against a declining probability of return.
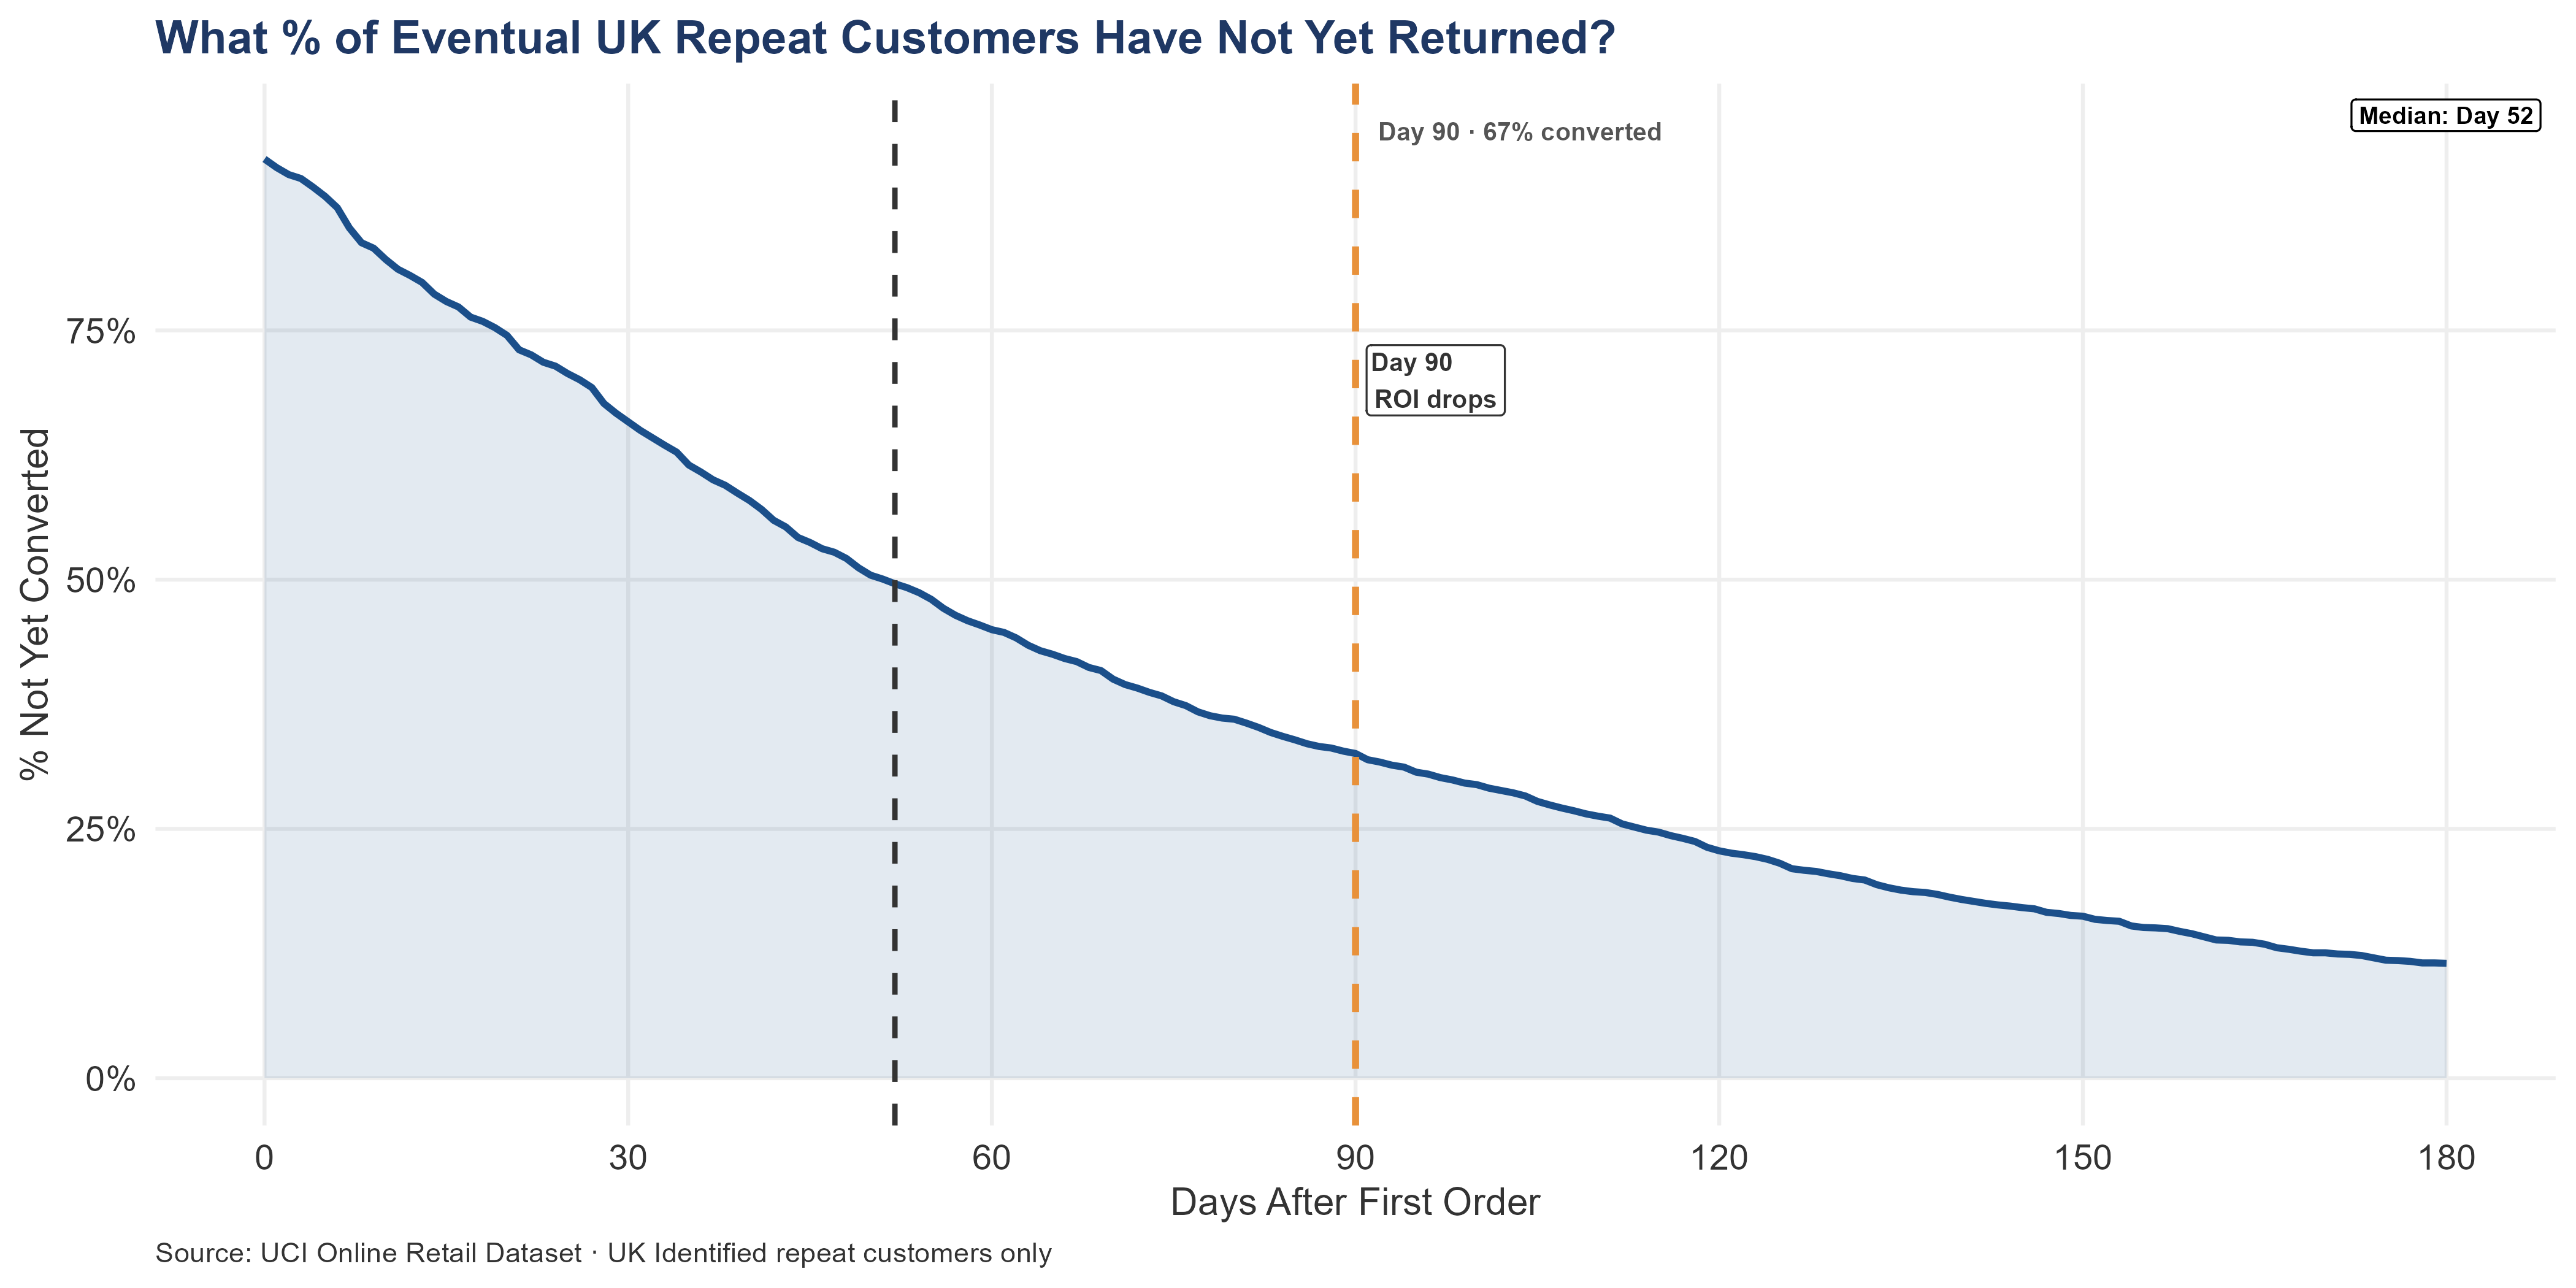
These figures exclude the 34.54% of first-time UK customers — 1,352 accounts — who never returned at all. The 52-day median describes when convertible customers tend to make their decision, not the median across all first-time buyers.
For an acquirer, these numbers set the operational design of the UK retention program. Every first-time UK customer enters a decision window after their first order, and the transaction record shows no evidence of any systematic contact program operating within it. A day-30 follow-up — a phone call for first orders above £300, an email for the rest — reaches customers at the point where the largest share are still undecided. Customers still silent past the survival-curve threshold should be reclassified to the lapsed reactivation pool rather than receiving open-ended follow-up. The cost of not running this program is not historical — it compounds with every new customer acquired without a trigger inside the window.
7.1.2 The International Window
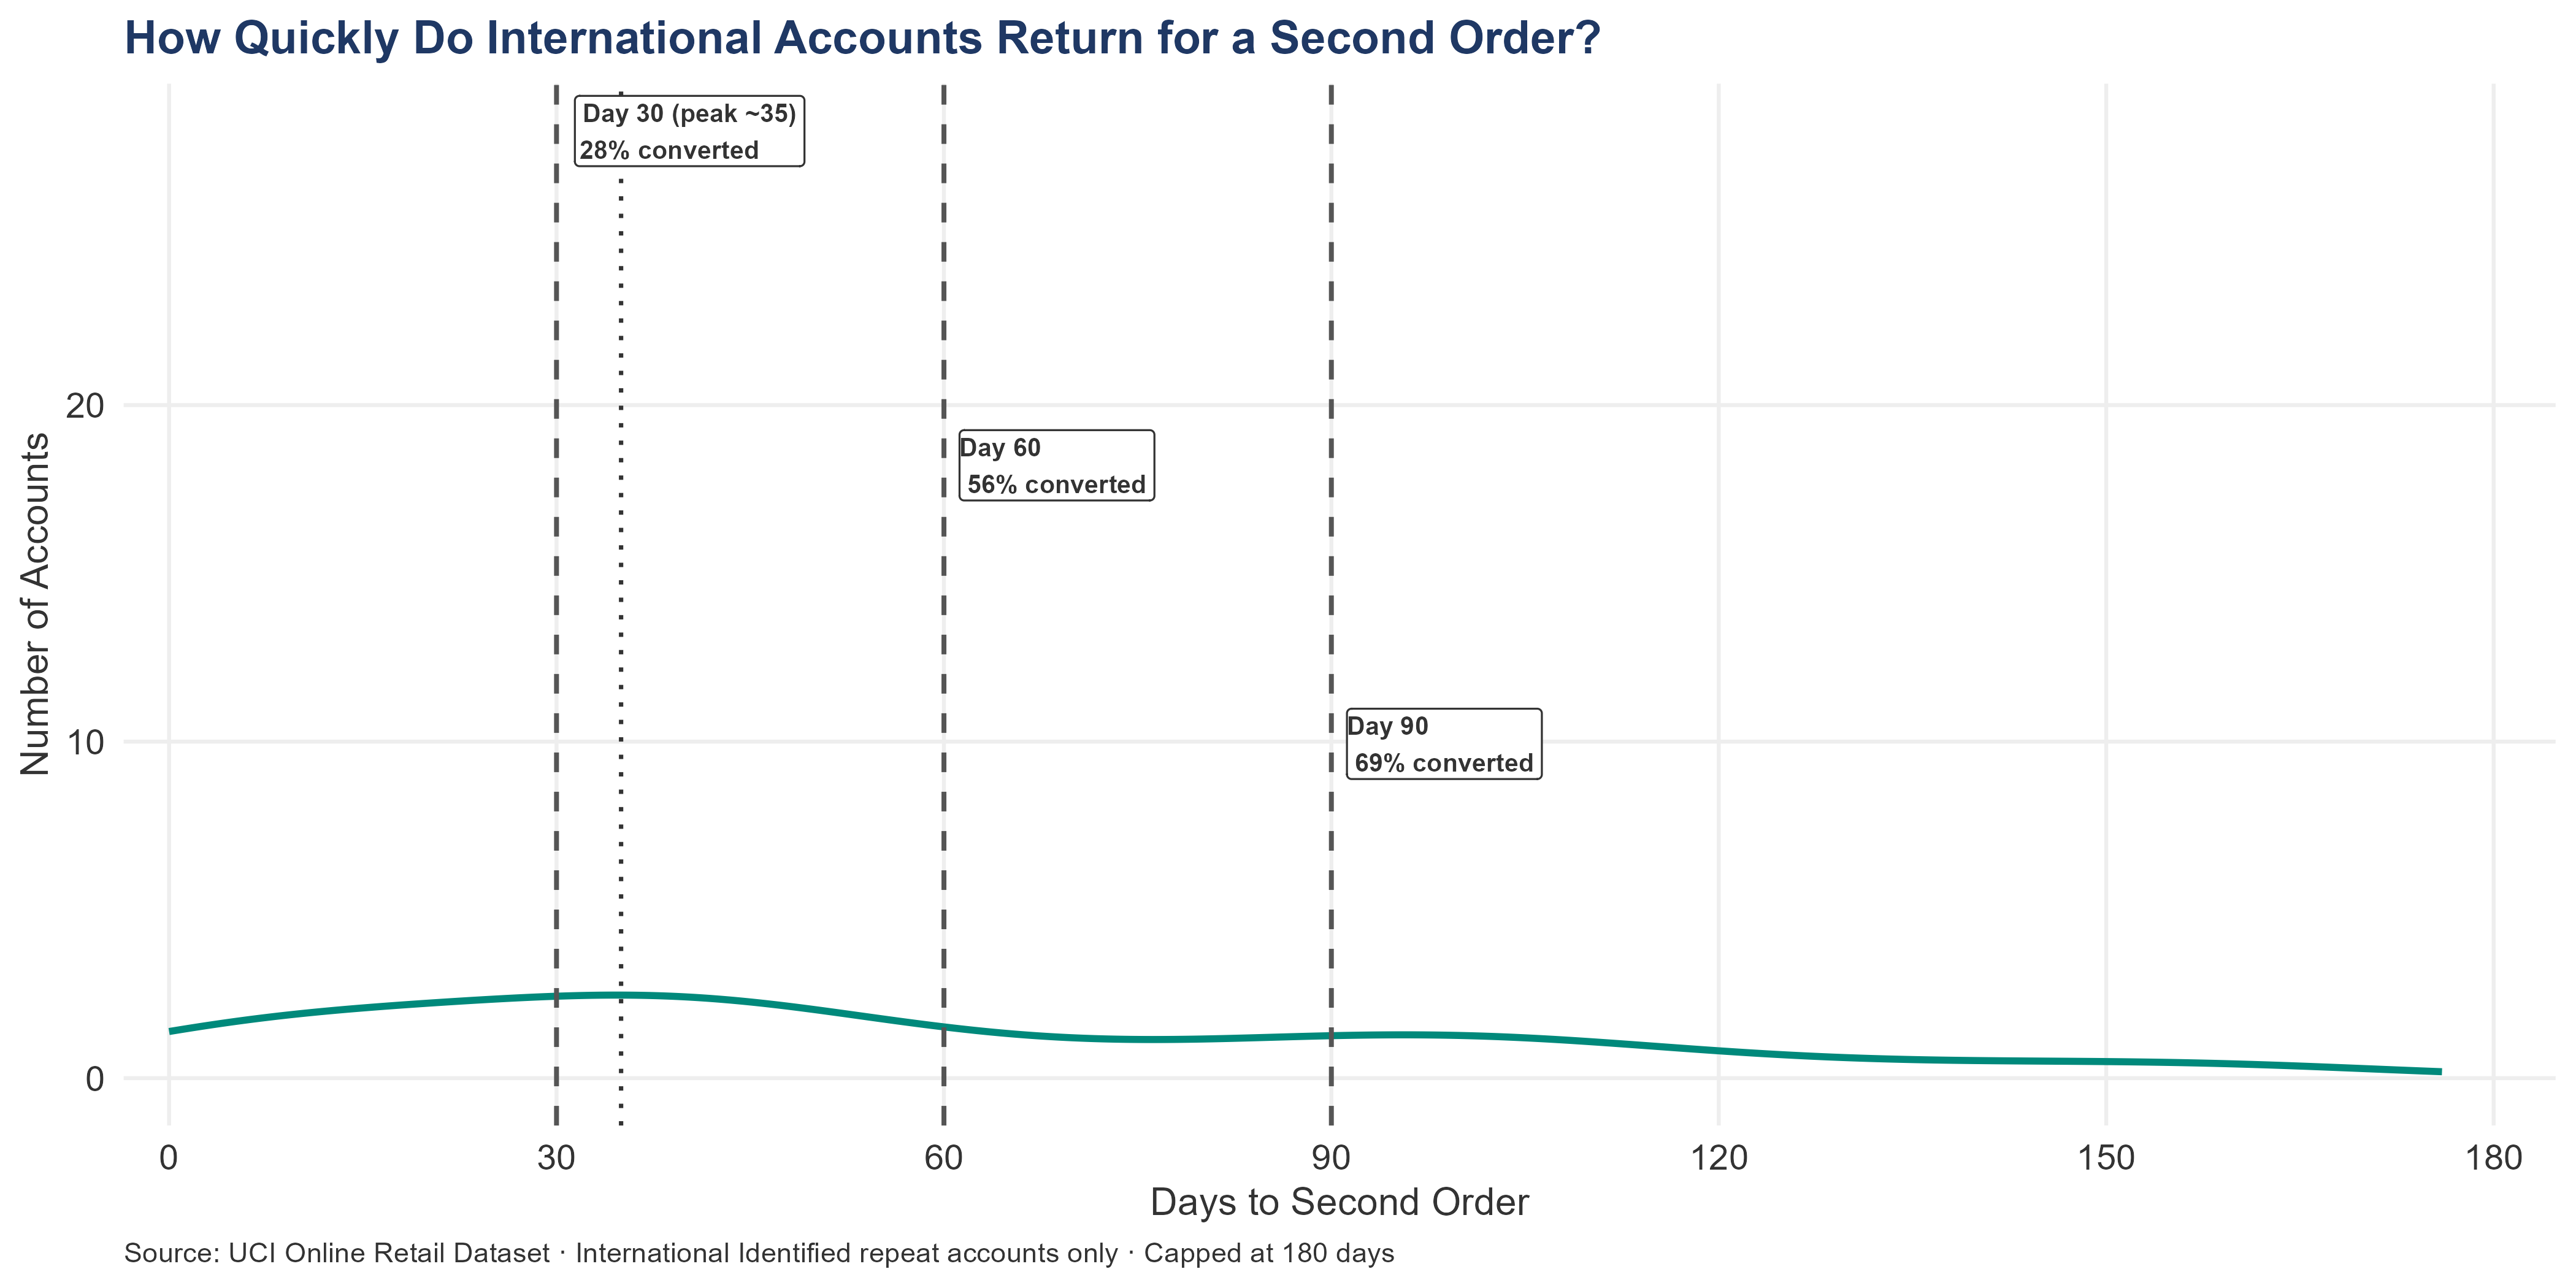
Among international customers who eventually placed a second order, 28% did so within 30 days. The peak natural return falls on Day 35 — nearly a month later than the UK peak. By Day 90, 69% have converted, a comparable cumulative rate to the UK despite the later peak.
The median international conversion point is Day 50, against Day 58 for the UK. The two segments convert at a similar pace overall, but the shape of the distribution differs: UK conversions concentrate sharply in the first two weeks, while international conversions spread more evenly across the first two months. A follow-up program copied from the UK’s day-30 trigger would miss the international peak. The international trigger should be calibrated to the Day 50 median rather than borrowed from the UK cadence.
These figures exclude the 36.71% of international first-time customers — across 152 accounts — who never returned. At an international median AOV of £391 against £299 for the UK, each unconverted international account represents a materially larger missed second order than its UK counterpart.
For an acquirer, the international follow-up program earns a higher per-account ROI than the UK equivalent and should be implemented before any other international retention initiative. Every new international account enters a 50-day decision window after its first order, and the transaction record shows no evidence that any program currently operates within it. Any account acquired after close will pass through that window without contact until the program goes live.
7.2 Reorder Intervals — How Often Do Customers Come Back?
The median reorder interval across all identified customers is 54 days — roughly every seven to eight weeks. An account silent beyond this threshold is in the second half of its typical return window, with a declining probability of return for each additional week.
This 54-day figure is the operational clock for customer management. Any account silent for 90 or more days has missed at least one full reorder cycle. Any account silent for 180 or more days has missed roughly three.
7.2.1 Reorder Interval by Segment
The chart above measures the whole business — all identified customers regardless of segment. The 54-day median is the baseline reorder clock across the full customer base. But that single figure conceals meaningful variation by frequency tier. Frequent customers (10+ orders) reorder on a tighter cycle than Regular (4–9) or Occasional (2–3) accounts. A single outreach cadence applied uniformly across tiers mistimes both ends: it over-contacts Occasional customers still within their natural buying rhythm and under-contacts Frequent customers who are already overdue. The 75th-percentile gap for each tier defines the “overdue” threshold — the point at which an account has been silent longer than three-quarters of its comparable peers. At the December 9 data cutoff, 44 Frequent accounts have crossed that line.
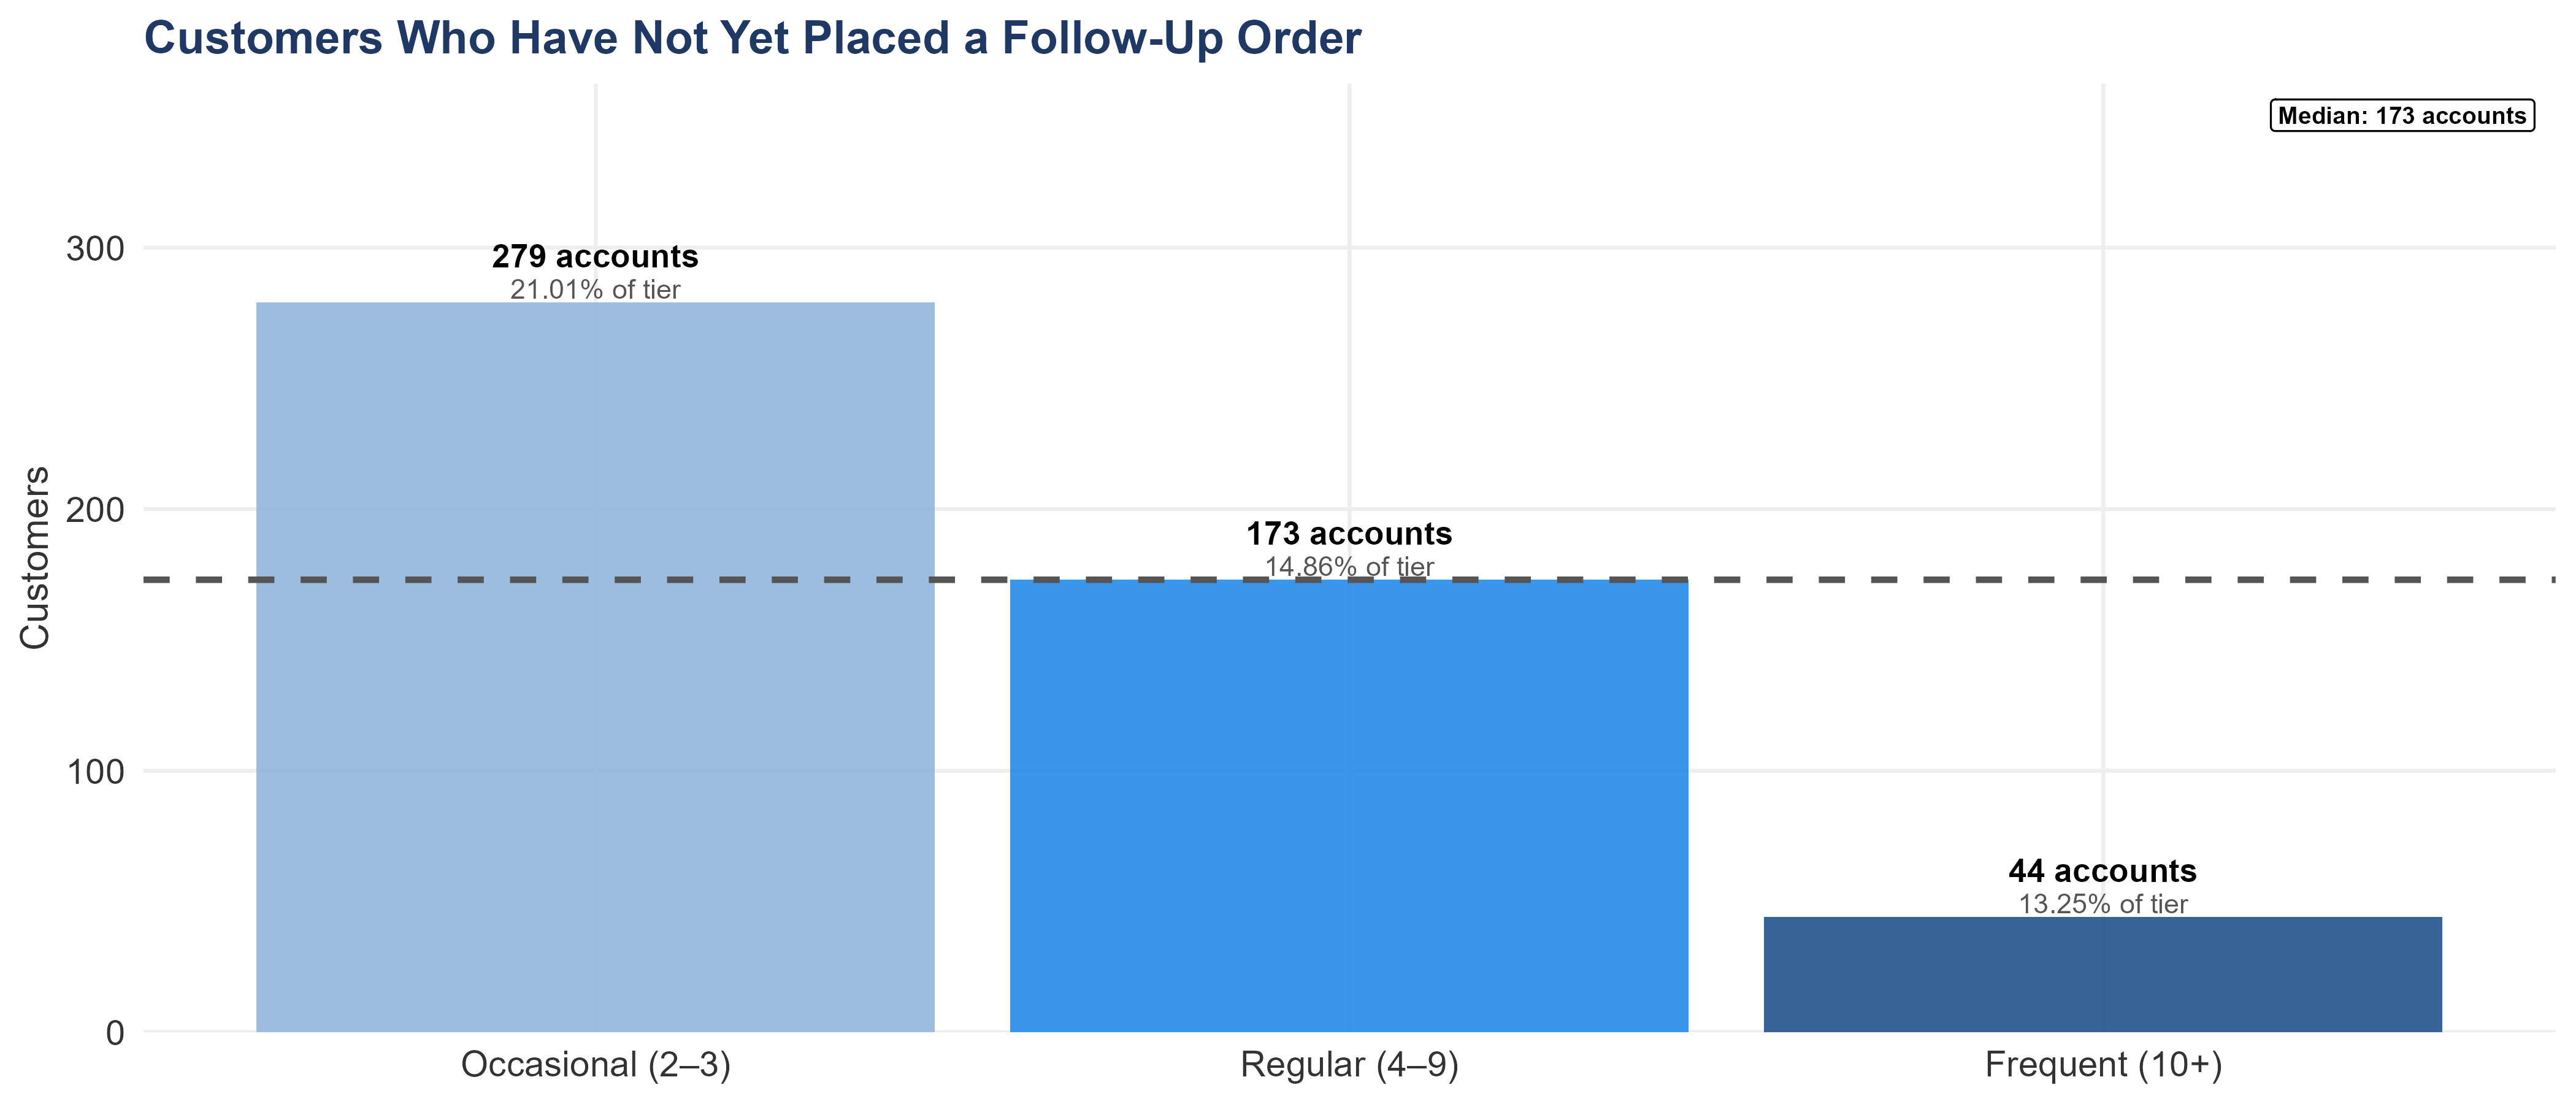
That threshold flags roughly one in four healthy accounts at any snapshot by design, putting the expected baseline at about 83 Frequent customers. The 44 actual count is therefore below that baseline — a signal that the Frequent tier as a whole is ordering more consistently than the threshold would predict. Each flagged account still warrants contact: at £11.59K average annual revenue per Frequent customer, each additional week of silence costs roughly £223 per account in foregone revenue. Q4 holiday patterns may account for part of the silence given the December 9 cutoff, so validating each flagged account against its Q4 order history is the pre-close DD step before sizing the recovery exposure. Running the overdue detection report is the first day-1 action for a new owner: it is a pre-built list of the accounts most at risk of having already churned or churning imminently.
| Frequency Tier | Median Interval (days) | Typical Range (days) | Accounts in Tier | Currently Flagged |
|---|---|---|---|---|
| Occasional (2–3) | 83 | 38–151 | 1,328 | 279 |
| Regular (4–9) | 43 | 21–74 | 1,164 | 173 |
| Frequent (10+) | 14 | 7–27 | 332 | 44 |
The UK-specific view:
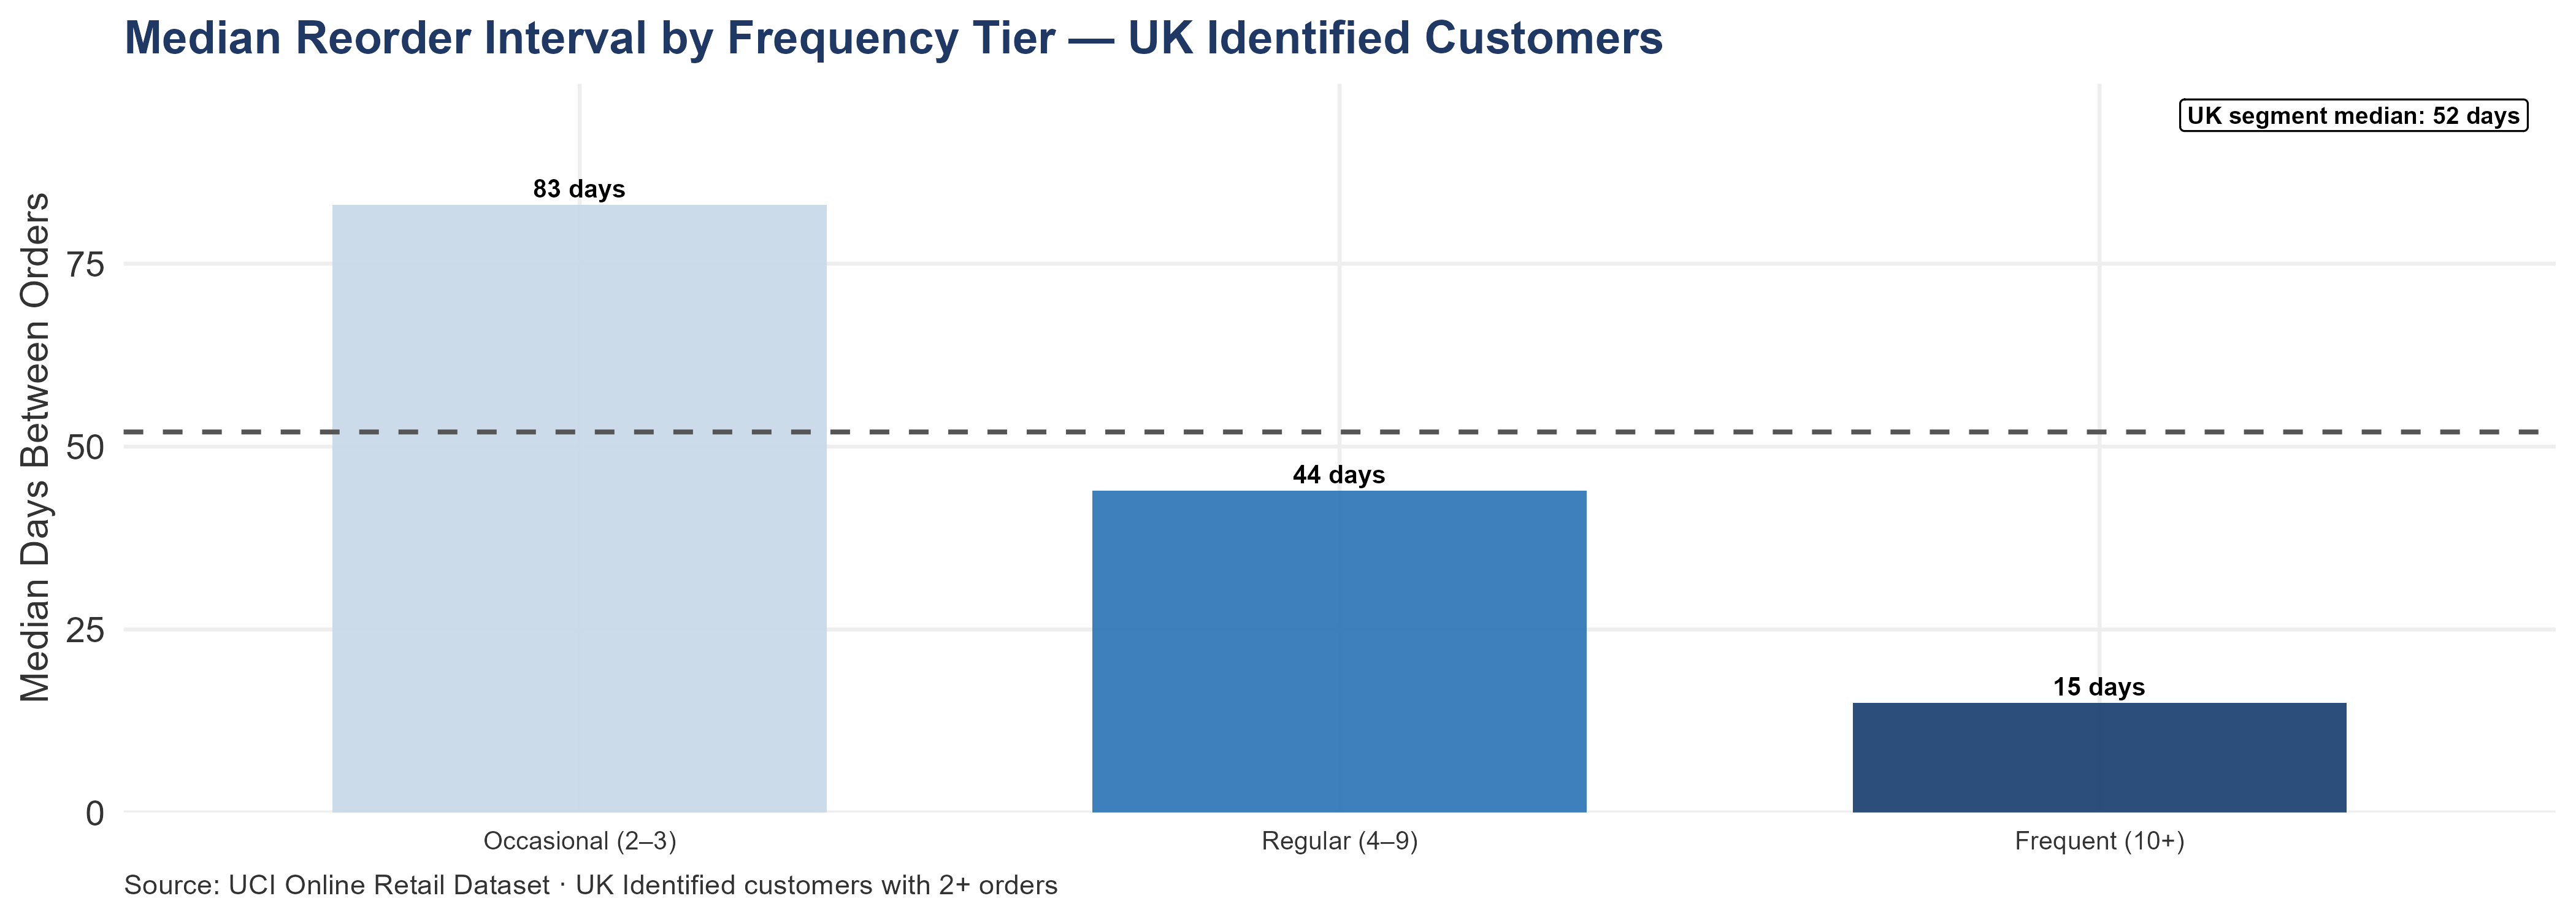
7.2.2 UK Reorder Intervals by Tier
Frequent customers (10+ orders) reorder most tightly; Regular accounts (4–9 orders) stretch wider; Occasional accounts (2–3 orders) wider still. The UK segment median of 52 days blends all three — a single cadence applied uniformly across tiers over-contacts Occasional customers still within their natural rhythm and under-contacts Frequent customers already past theirs. Both errors carry a cost: the first creates friction with active accounts, the second allows high-value accounts to drift undetected.
Frequent accounts flagged as overdue have been silent longer than three-quarters of their peers. These are established wholesale accounts with documented purchasing histories. At the observed annual revenue per Frequent customer, each additional week of unaddressed silence carries a computable opportunity cost. The overdue accounts identified at the data cutoff warrant contact in the first week post-close.
The 75th-percentile threshold flags roughly one in four healthy Frequent customers at any given snapshot by design. The actual flagged count should be compared to that expected baseline before drawing conclusions about segment health. A count at or below the baseline indicates that fewer accounts are overdue than the threshold would normally produce — a positive signal about UK Frequent retention at this snapshot.
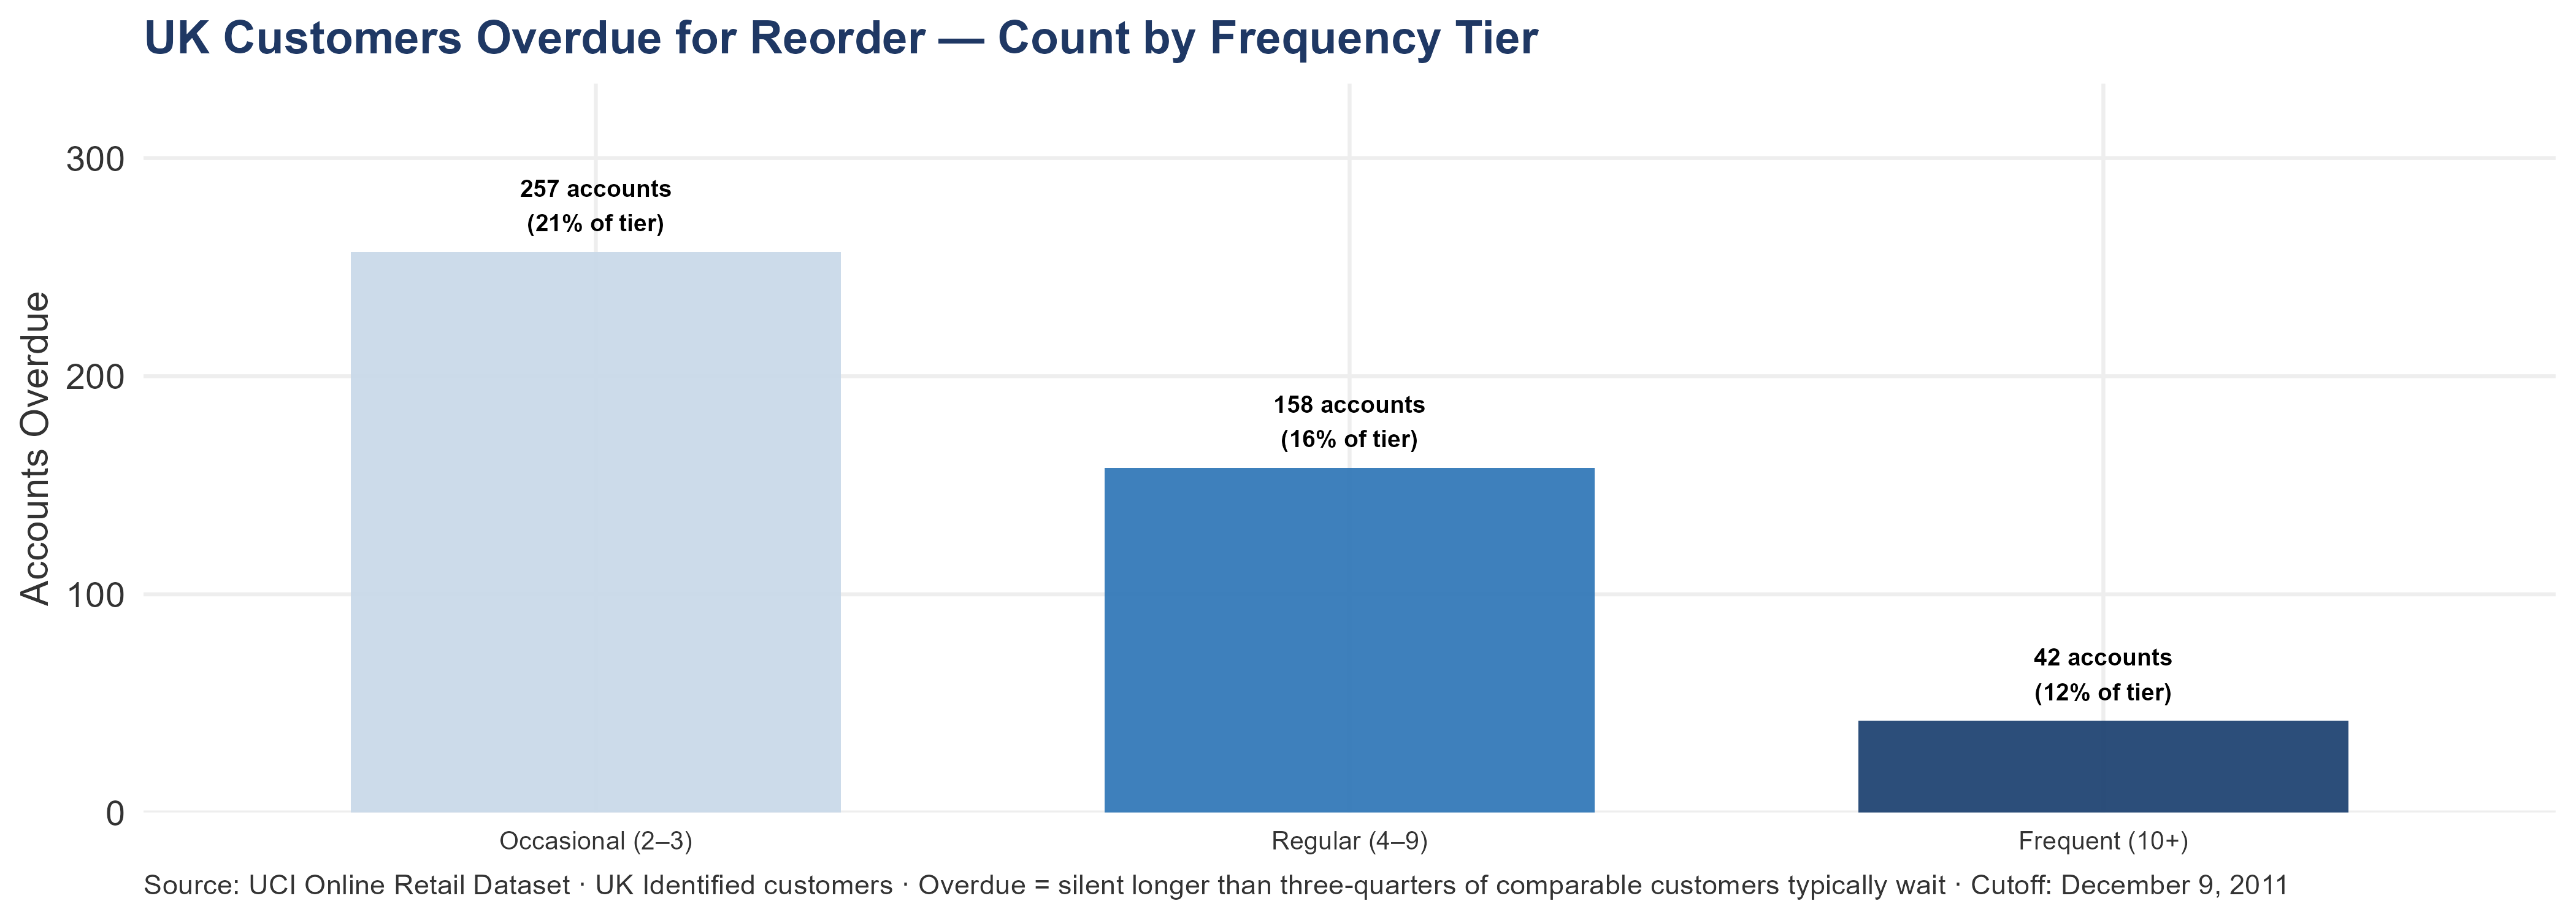
Overdue UK Frequent Customers — Grouped by Frequency Tier
These accounts have been silent longer than the 75th-percentile inter-order gap for their personal cadence — the point at which three-quarters of comparable customers have already reordered. The grouped view shows where the documented value sits across the frequency tiers. The Frequent row is the time-sensitive one for DD outreach.
| Tier | Account Count | Combined Net Revenue | Median Days Silent | Investigation Priority |
|---|---|---|---|---|
| Frequent (10+) | 42 | £251.91K | 44 | Investigate first — established cadence broken |
| Regular (4–9) | 158 | £249.76K | 112 | Investigate — relationship interruption |
| Occasional (2–3) | 255 | £212.68K | 204 | Reactivation pool — sized for bulk outreach |
For the International segment:
7.2.3 International Reorder Intervals
International reorder intervals are longer than UK intervals, which is consistent with cross-border logistics and ordering cycles. An Australian wholesale account ordering every 90 days is not less engaged than a Dutch account ordering every 45 days — the difference reflects geography, not loyalty.
Applying UK-calibrated thresholds to international accounts would flag healthy accounts as overdue and risk unnecessary disruption. The international segment needs its own cadence benchmarks.
International reorder intervals are longer than UK intervals, consistent with cross-border logistics and ordering cycles. An acquirer applying UK-cadence outreach thresholds to international accounts will flag healthy accounts as overdue and risk unnecessary disruption. The international Frequent tier’s median interval is the correct calibration input for the international CRM system.
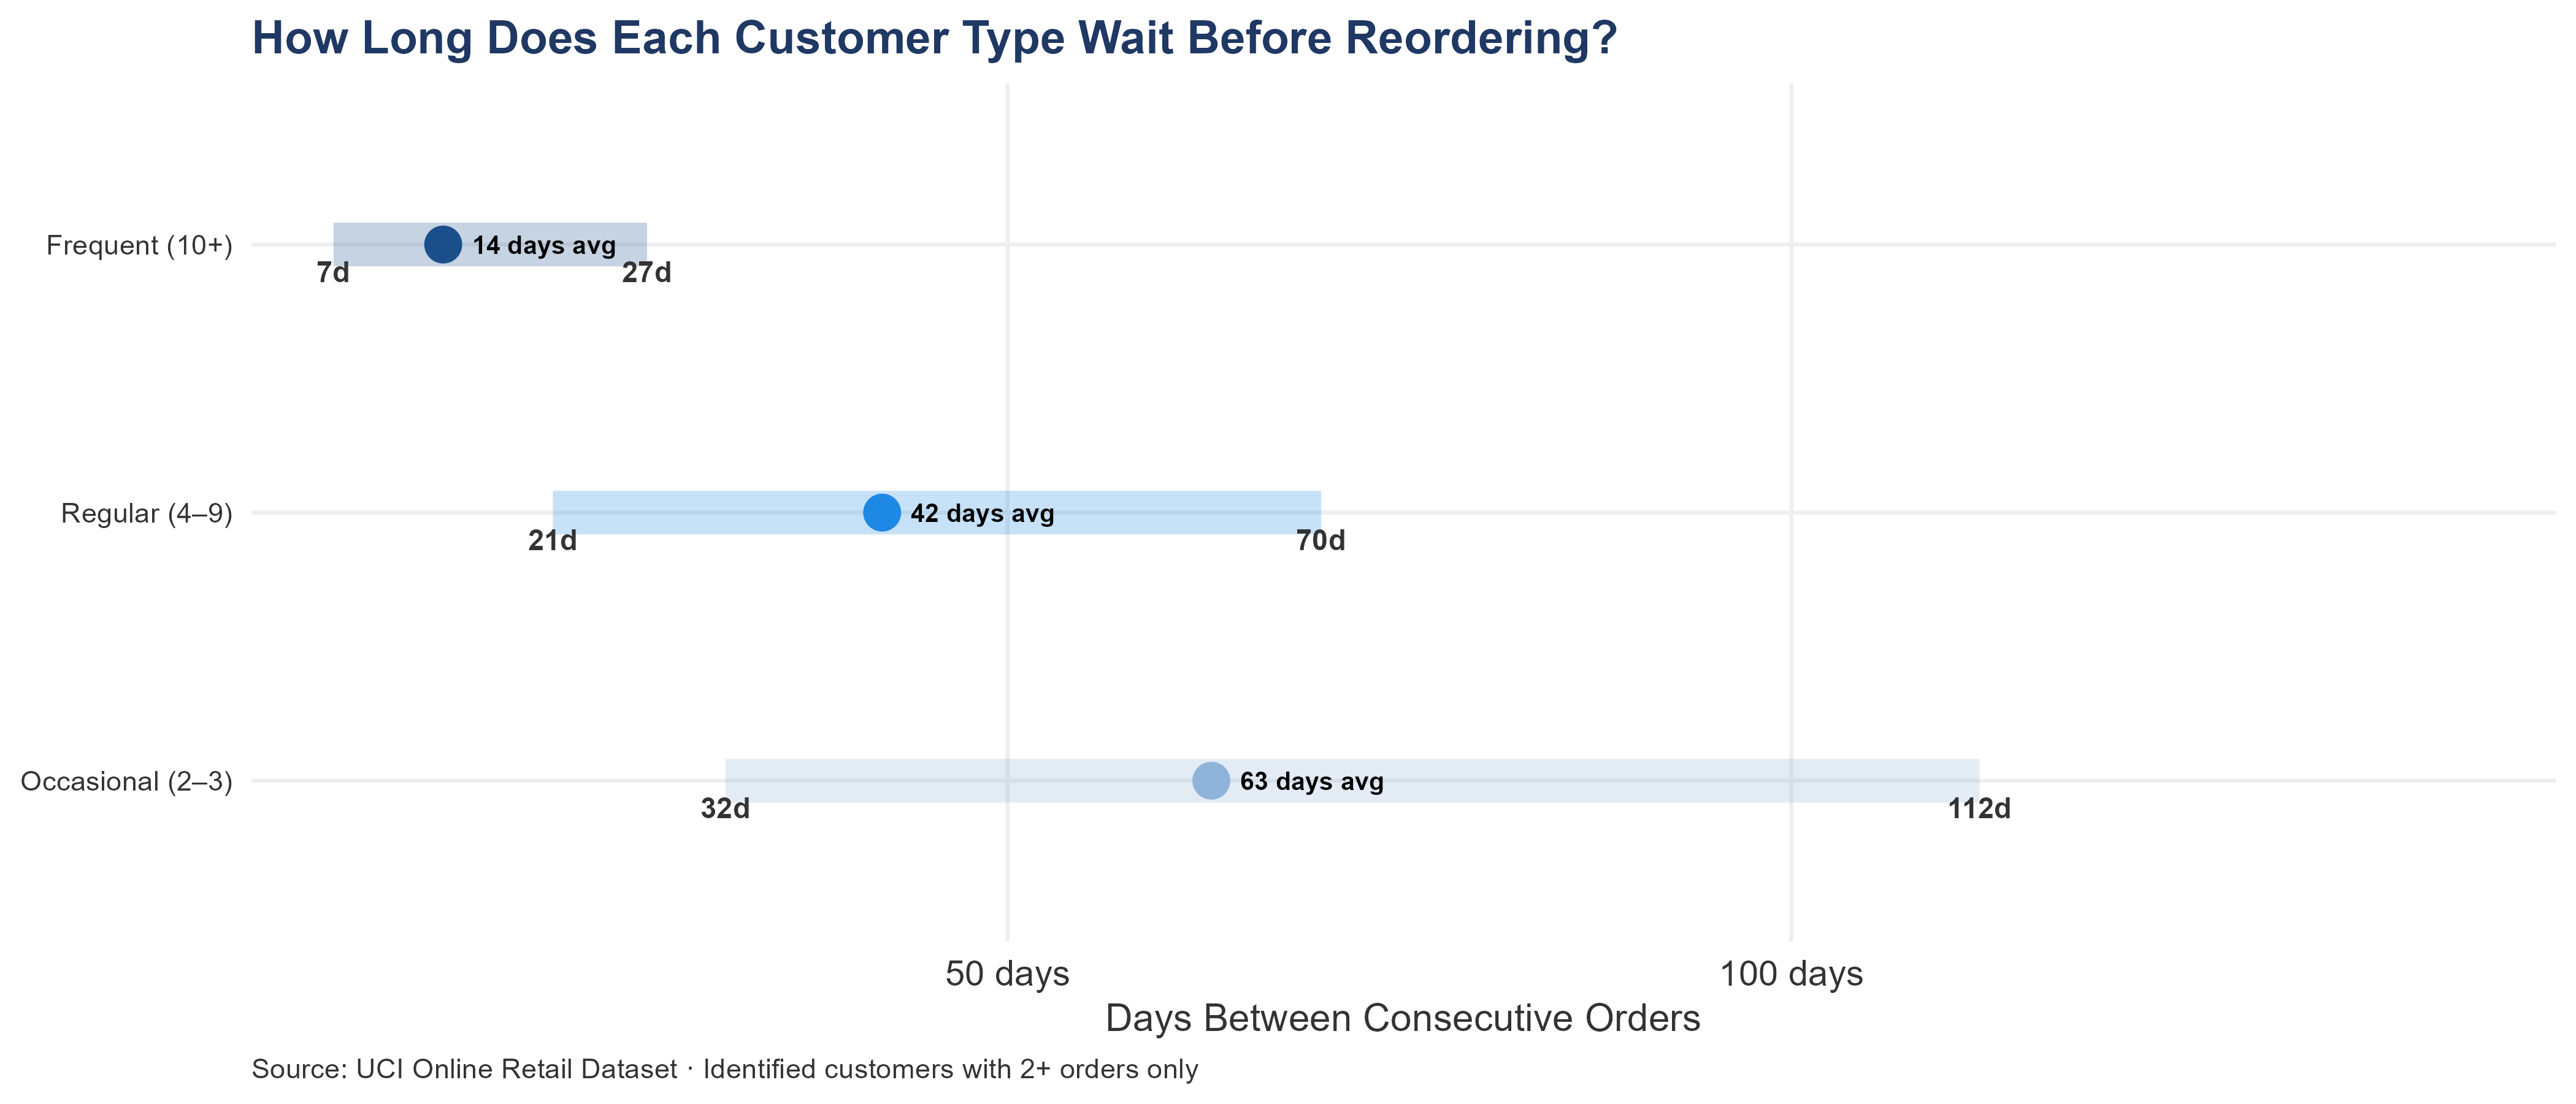
The international segment median is 52 days; the UK segment median is 52 days. A single segment-level median blends Frequent accounts that reorder every few weeks with Occasional accounts that place only two or three orders across the entire year. Breaking it out by tier is what produces the cadence that matters for outreach.
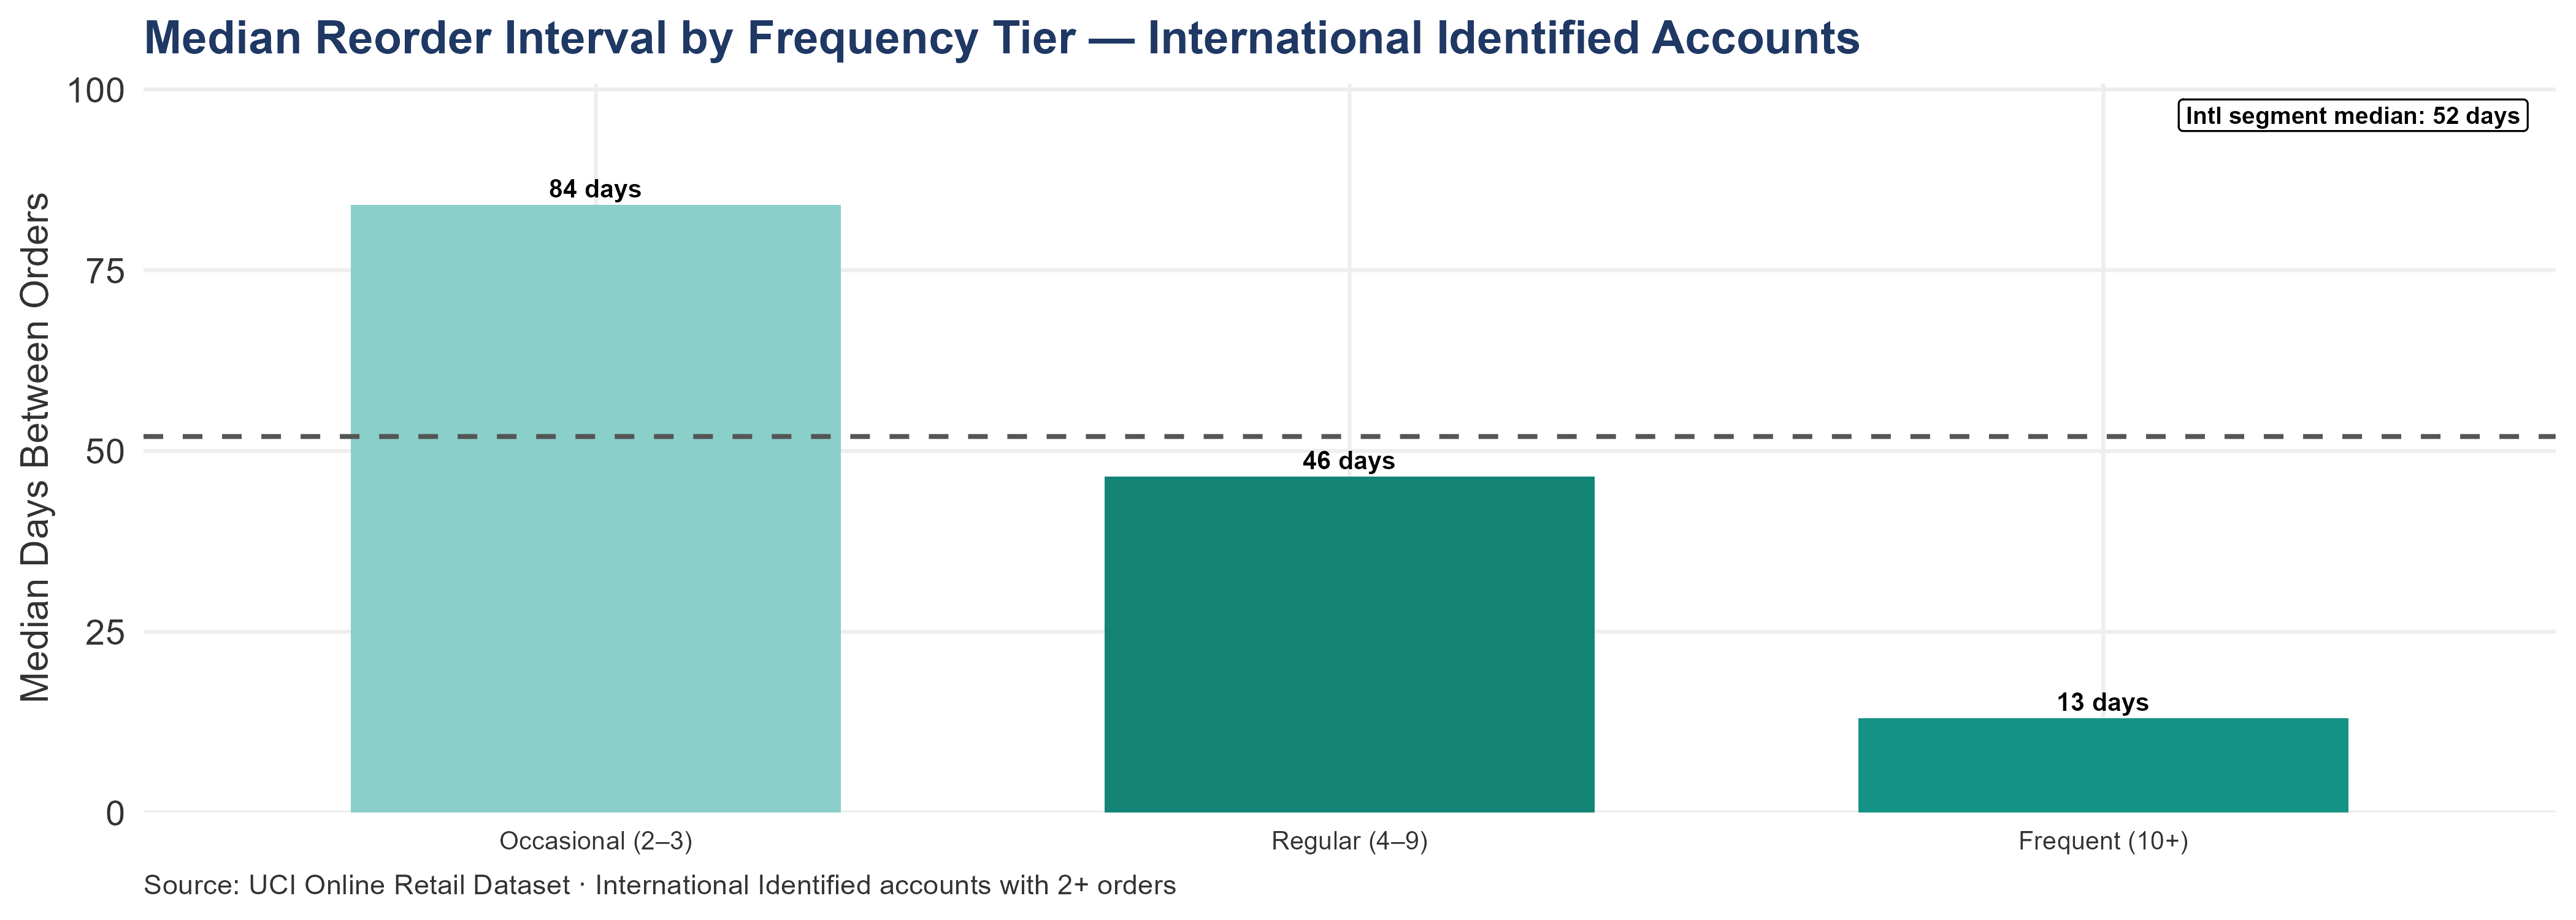
The international median reorder interval of 52 days means 50% of returning international customers place their next order within 52 days. Given international accounts’ higher per-order value, an account silent beyond 52 days represents elevated revenue risk relative to a UK account at the same silence duration. Frequent international accounts (10+ orders) reorder every 13 days at the median — roughly every 2 weeks. Regular accounts (4–9 orders) sit at 46 days. Occasional accounts (2–3 orders) stretch to 84 days. For comparison, UK Frequent customers reorder every 21 days at the UK Frequent tier median — the like-for-like comparison shows international Frequent accounts reorder at a slightly faster pace than their UK counterparts. The Frequent-tier gap runs in the opposite direction to the segment-wide gap (international Frequent faster than UK Frequent, even while the segment-wide median is slightly wider) because lower-frequency international accounts’ longer gaps pull the segment median out; among high-frequency accounts, international reorder cadence is not materially slower than UK. An international account manager using UK reorder cadences as the outreach trigger will flag Occasional accounts too early.
Load the tier-specific reorder thresholds into the CRM on day 1 post-close: Frequent at 13 days, Occasional at 84 days. Using UK thresholds for international accounts generates false overdue flags for Occasional customers and misses genuine early-lapse signals for Frequent customers. The per-tier calibration is the difference between a contact program that works and one that creates noise.
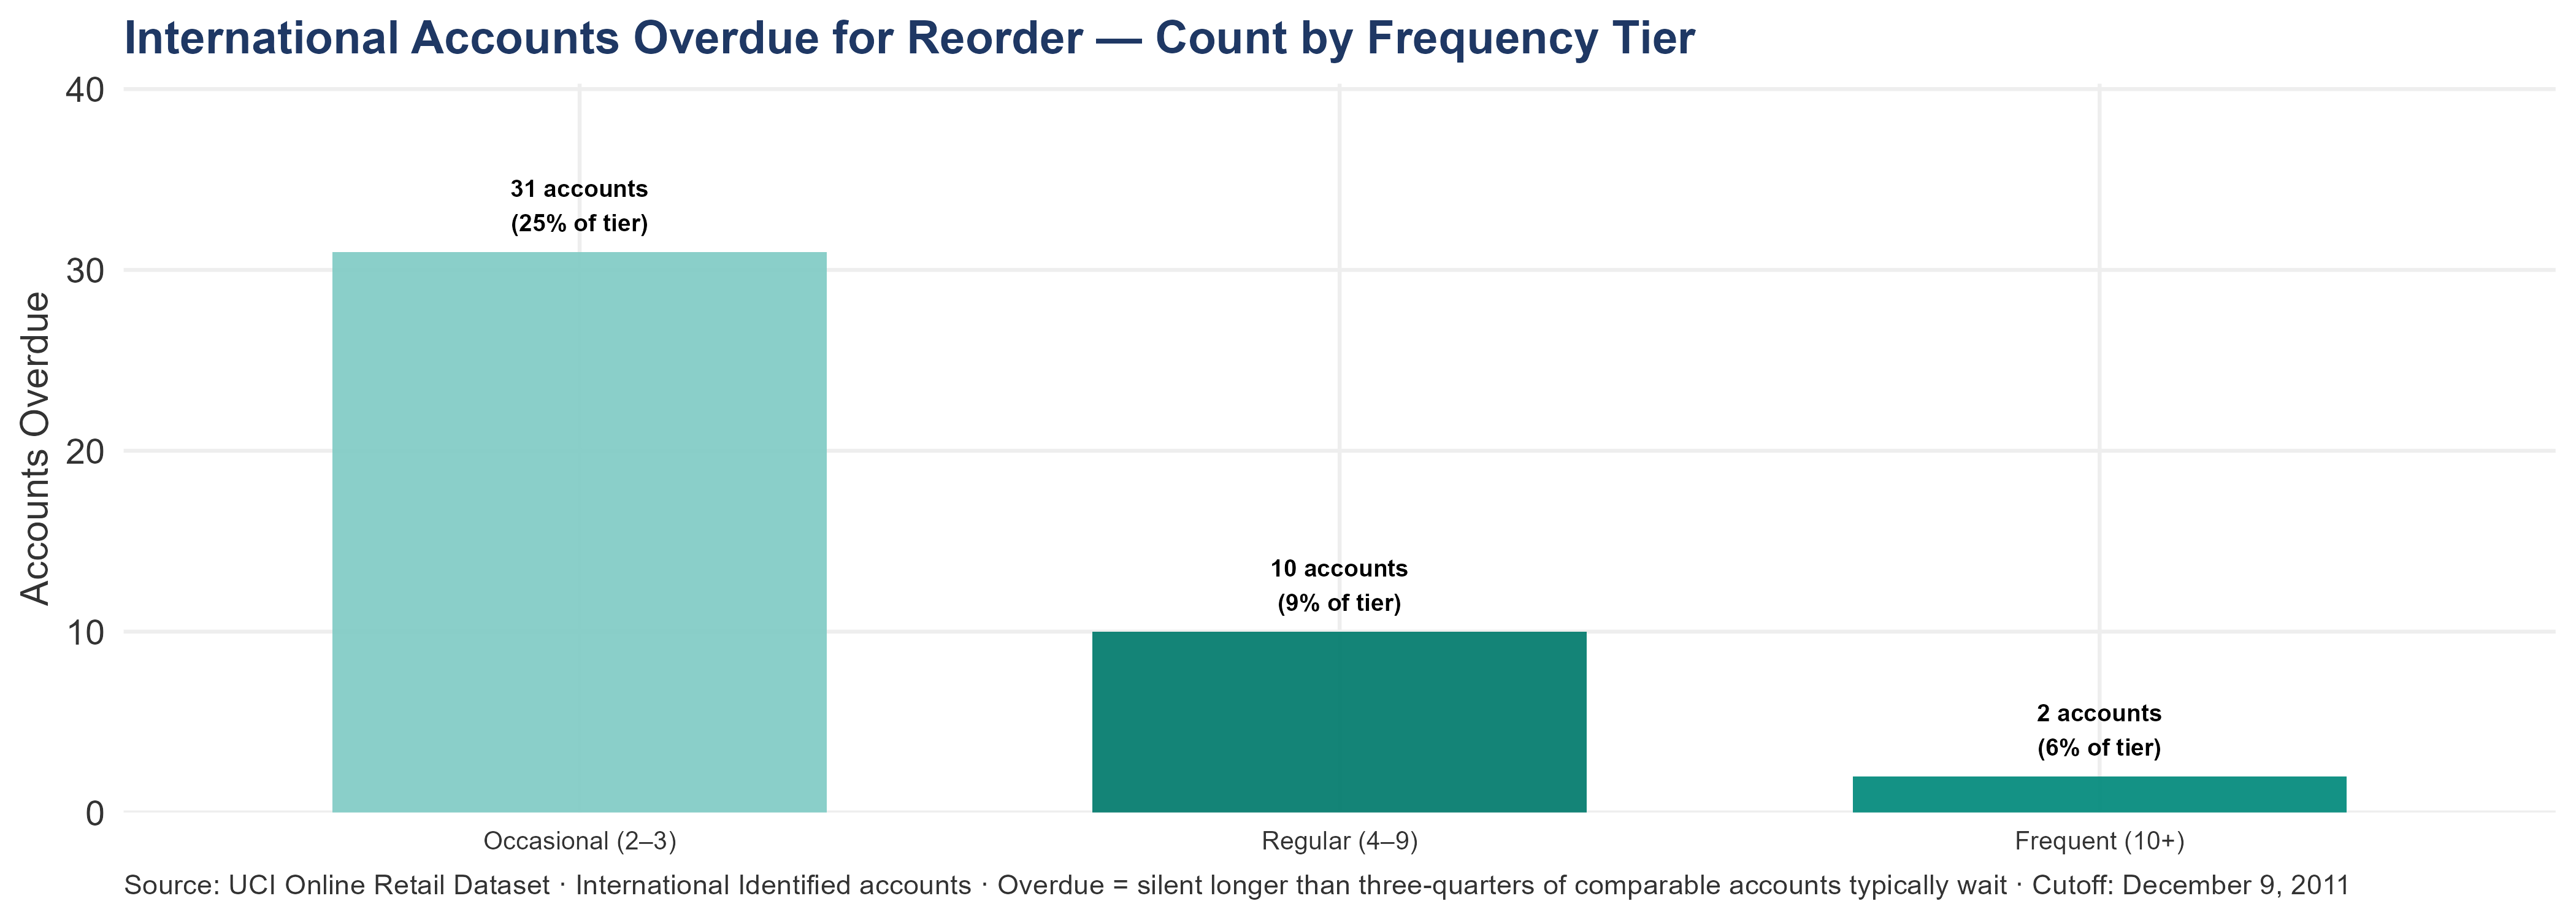
The Frequent tier has 2 international accounts that have been silent longer than three out of four comparable accounts typically wait between orders. In the international segment, where individual account revenue is high and the account base is small, losing even one Frequent account has an outsized impact. These are not cold leads — they are established wholesale accounts with documented purchasing histories who have gone quiet. These 2 accounts are the first calls post-close. A new owner reaching out simultaneously addresses the silence and introduces the change in ownership. At the international 3-year LTV, recovering even one of these accounts produces more forward value than acquiring a typical new international account at zero acquisition cost.
The data cutoff is December 9, 2011. International accounts may have longer natural Q4 pauses than UK accounts due to different holiday calendars — European accounts may pause in August, Middle Eastern accounts during Ramadan, and Asia-Pacific accounts around Lunar New Year preparation. Validate each flagged account against their historical seasonal pattern before initiating outreach.
At any given moment, roughly 25% of healthy Frequent accounts will naturally be in a gap longer than what three-quarters of their peers have waited — that is how the threshold works. The expected count at any snapshot is approximately 8 accounts. The current count of 2 is at or below that statistical expectation.
7.2.4 Regional Patterns
Reorder intervals vary by region within the international segment. European markets tend toward tighter intervals than more distant markets. These regional differences reflect logistical realities more than relationship quality — an Australian wholesale account ordering every 90 days is not less engaged than a Dutch account ordering every 45 days. Regional cadence calibration prevents the account team from misdiagnosing logistics-driven intervals as relationship failures.
Only regions with 5 or more repeat accounts are included — smaller regions have too few data points for reliable behavioral metrics.
7.2.5 Reorder Intervals by Region
Does the ordering cadence differ by region — or is the segment-wide median a reliable guide everywhere?
The regional reorder chart above shows a data quality signal: British Isles at 2 days at the median, which is too short to be a real wholesale reorder cycle. This is a data-quality signal, not a cadence signal — accounts in this region place multiple invoices on consecutive days as part of a single purchasing session, which the gap calculation counts as separate reorder events. Do not use the 2-day figure as a cadence trigger. Use the segment-wide median of 52 days for British Isles outreach until a validated regional cadence is available. The remaining regional figures below are informative but subject to the same data-quality question.
British Isles has the tightest reorder cadence at 2 days — faster than the segment median. Eastern Europe has the widest at 51 days. The range is 49 days from fastest to slowest region. This spread is large enough to warrant region-specific outreach cadences. An account manager using the segment median of 52 days as the trigger for all regions will flag British Isles accounts too late and Eastern Europe accounts too early. Configure region-specific silence thresholds in CRM post-close.
WarningData Quality Caveat — British Isles Reorder Median of 2 Days
A median reorder interval of 2 days is unusually short for a wholesale reorder cycle. This figure likely reflects same-day or next-day multi-invoice ordering patterns — accounts in this region place multiple invoices on consecutive days as part of a single purchasing session, which the gap calculation counts as separate reorder events even after deduplication to unique order dates. Do not use this figure as a cadence trigger without validation. The account manager for British Isles should confirm the actual reorder cadence with the region’s accounts directly. Until validated, use the segment-wide median of 52 days as the outreach trigger for this region.
7.2.6 Conversion Window by Region
Do first-time accounts in different regions take different amounts of time to return for a second order?
Asia-Pacific accounts convert fastest — median 45 days to second order, with 43% converting within 30 days. British Isles accounts take longest at 100 days. The segment-wide conversion window of 51 days is the average — regional managers should calibrate their day-30 follow-up timing based on these regional medians. A British Isles account contacted at day 30 may still be in its natural decision window; a Asia-Pacific account at day 30 may already have decided. Configure region-aware follow-up triggers post-close. A single segment-wide trigger is a reasonable start; regional calibration improves precision.
7.2.7 H1-to-H2 Retention by Region
Which regions retained accounts from H1 to H2 — and which lost them?
Eastern Europe retained 100.00% of its H1 accounts in H2 — the strongest retention among qualifying regions. Mediterranean retained only 53.33%. All regions retained at least 40% of their H1 accounts — no region shows catastrophic retention failure. Regional retention is broadly healthy; no pre-close investigation of regional churn patterns required.