8 Wallet Share & H1 vs H2 Momentum
8.1 Frequency Beats Basket Size
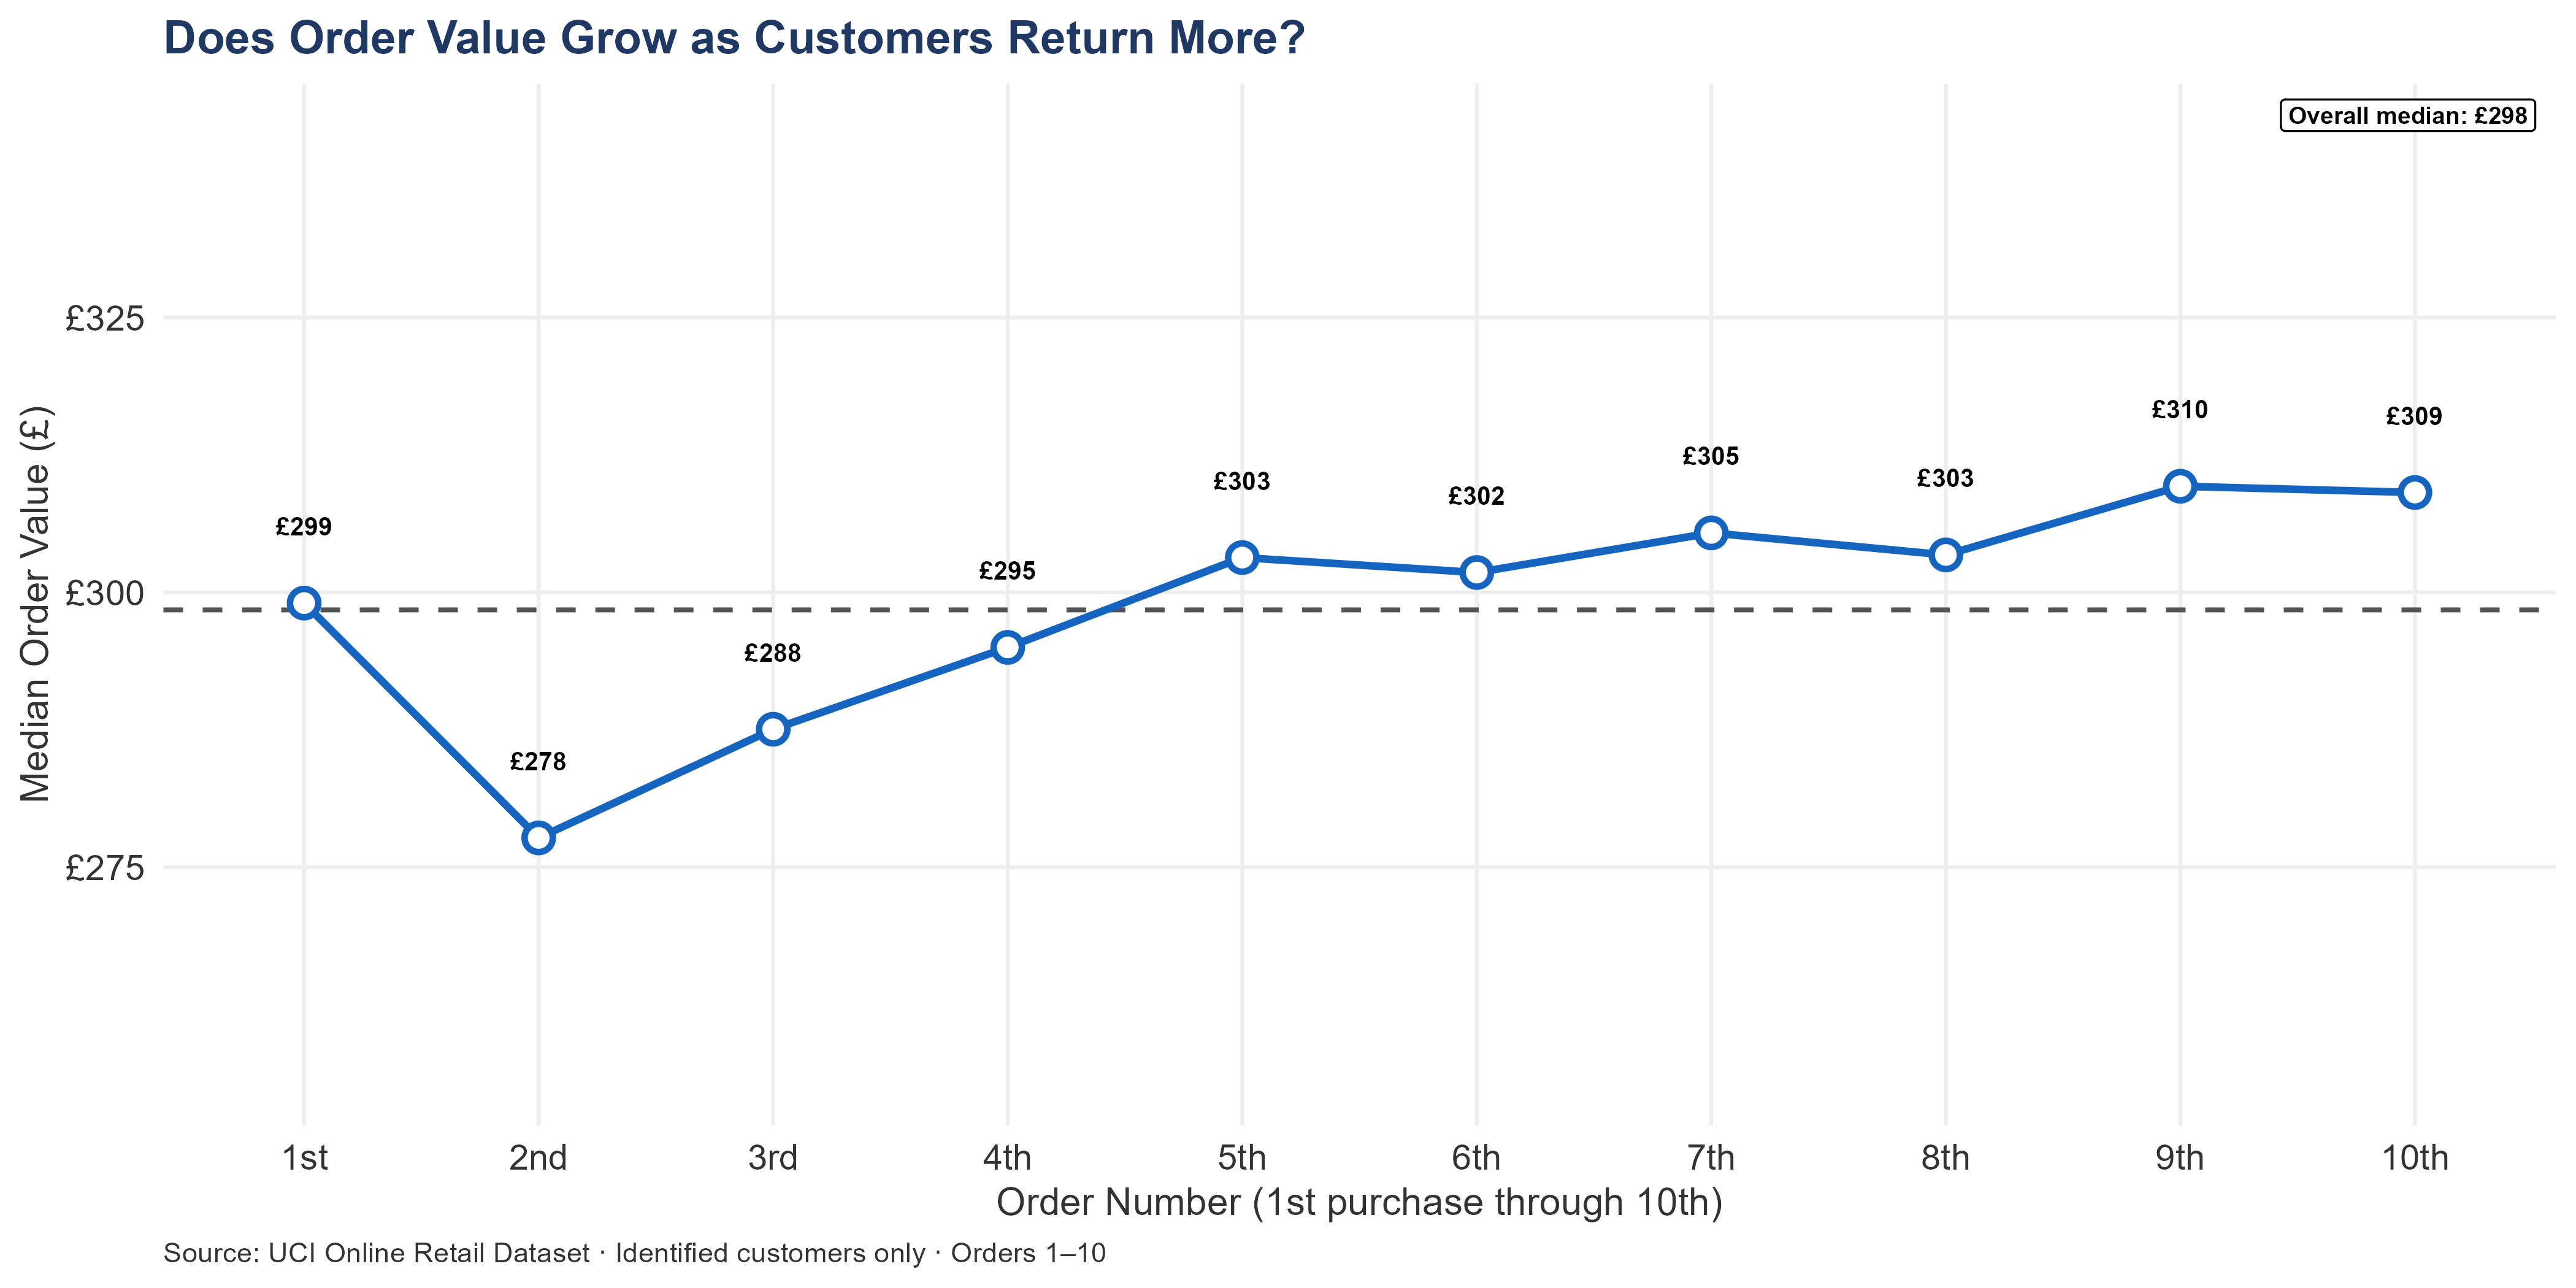
The question is whether the business benefits more from customers ordering more often or spending more per visit. The data answers clearly: order frequency is what separates the highest-value accounts from the rest.
The chart tracks median order value from a customer’s first order through their tenth. A rising line would indicate that customers spend more per visit as the relationship matures. The line is essentially flat, holding between £299 and £309 across the first ten orders. Customers do not increase their basket size as they become more familiar with the business. The return on programs designed to shorten the interval between orders is materially higher than the return on programs designed to increase per-visit spend.
8.1.1 UK Wallet Share
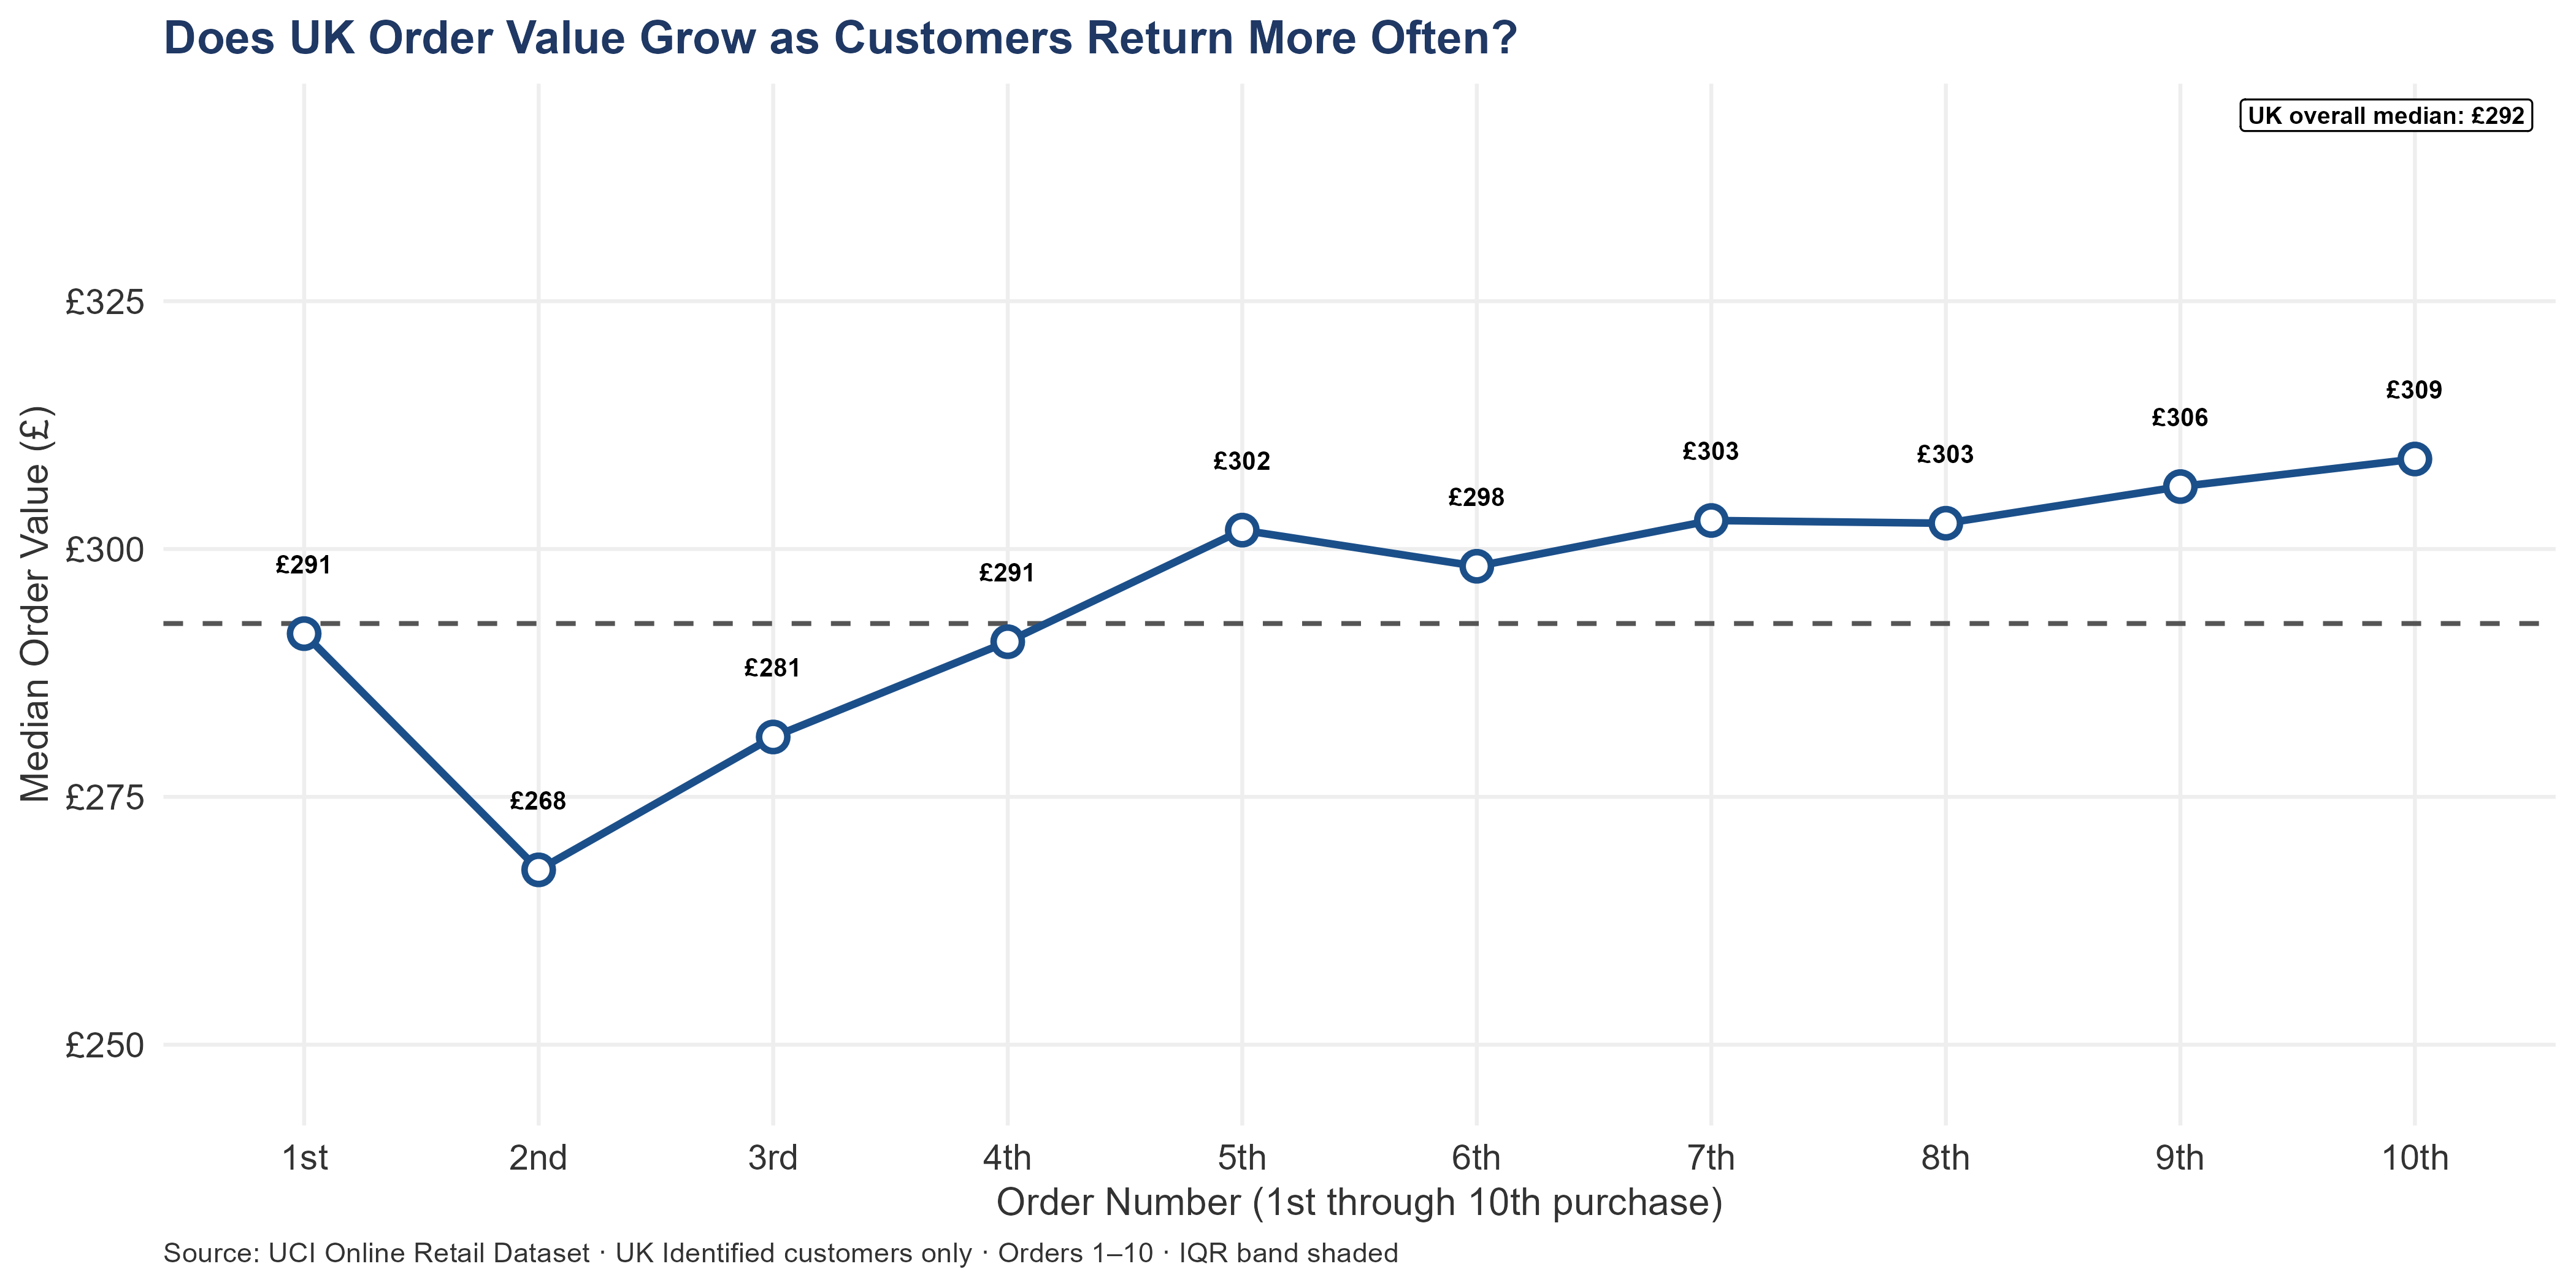
UK median order value is increasing from the first order to the 10th — £291 on the first order, £309 by order 10, tracking close to the UK overall median of £292 throughout. UK customers do not spontaneously increase their spend per visit as the relationship deepens; the growth lever is frequency, not basket size. One additional order per UK customer per year at that median, applied across 3,914 identified customers, generates approximately £1.14M in additional annual revenue — a theoretical ceiling that includes one-timers who may not return; restricted to the currently-retained pool of roughly 2,562 accounts that have placed at least two orders, the figure is approximately £749.35K.
For an acquirer, those numbers fix two financial-modeling decisions. Do not build revenue growth that depends on customers spending more per visit — the data shows it does not happen organically, and any upsell program would need active intervention (cross-sell conversations, bundled offers, product recommendations) to move the needle. Frequency programs — day-30 follow-up, overdue detection, lapsed reactivation — are grounded in observed behavior; model those first and treat upsell as incremental upside above the LTV baseline. Product-affinity cross-sell looks like a basket-size lever but operates through frequency too: a UK customer who adds a second product to a regular order has two independent reorder triggers instead of one, and the commercial effect runs through return cadence as much as through bigger baskets. The order-sequence median of £292 sits slightly above the segment-wide median AOV of £299 because it weights by order position rather than raw transaction count; both are correct, and the order-sequence figure is the right reference for wallet-share analysis.
8.1.2 International Wallet Share
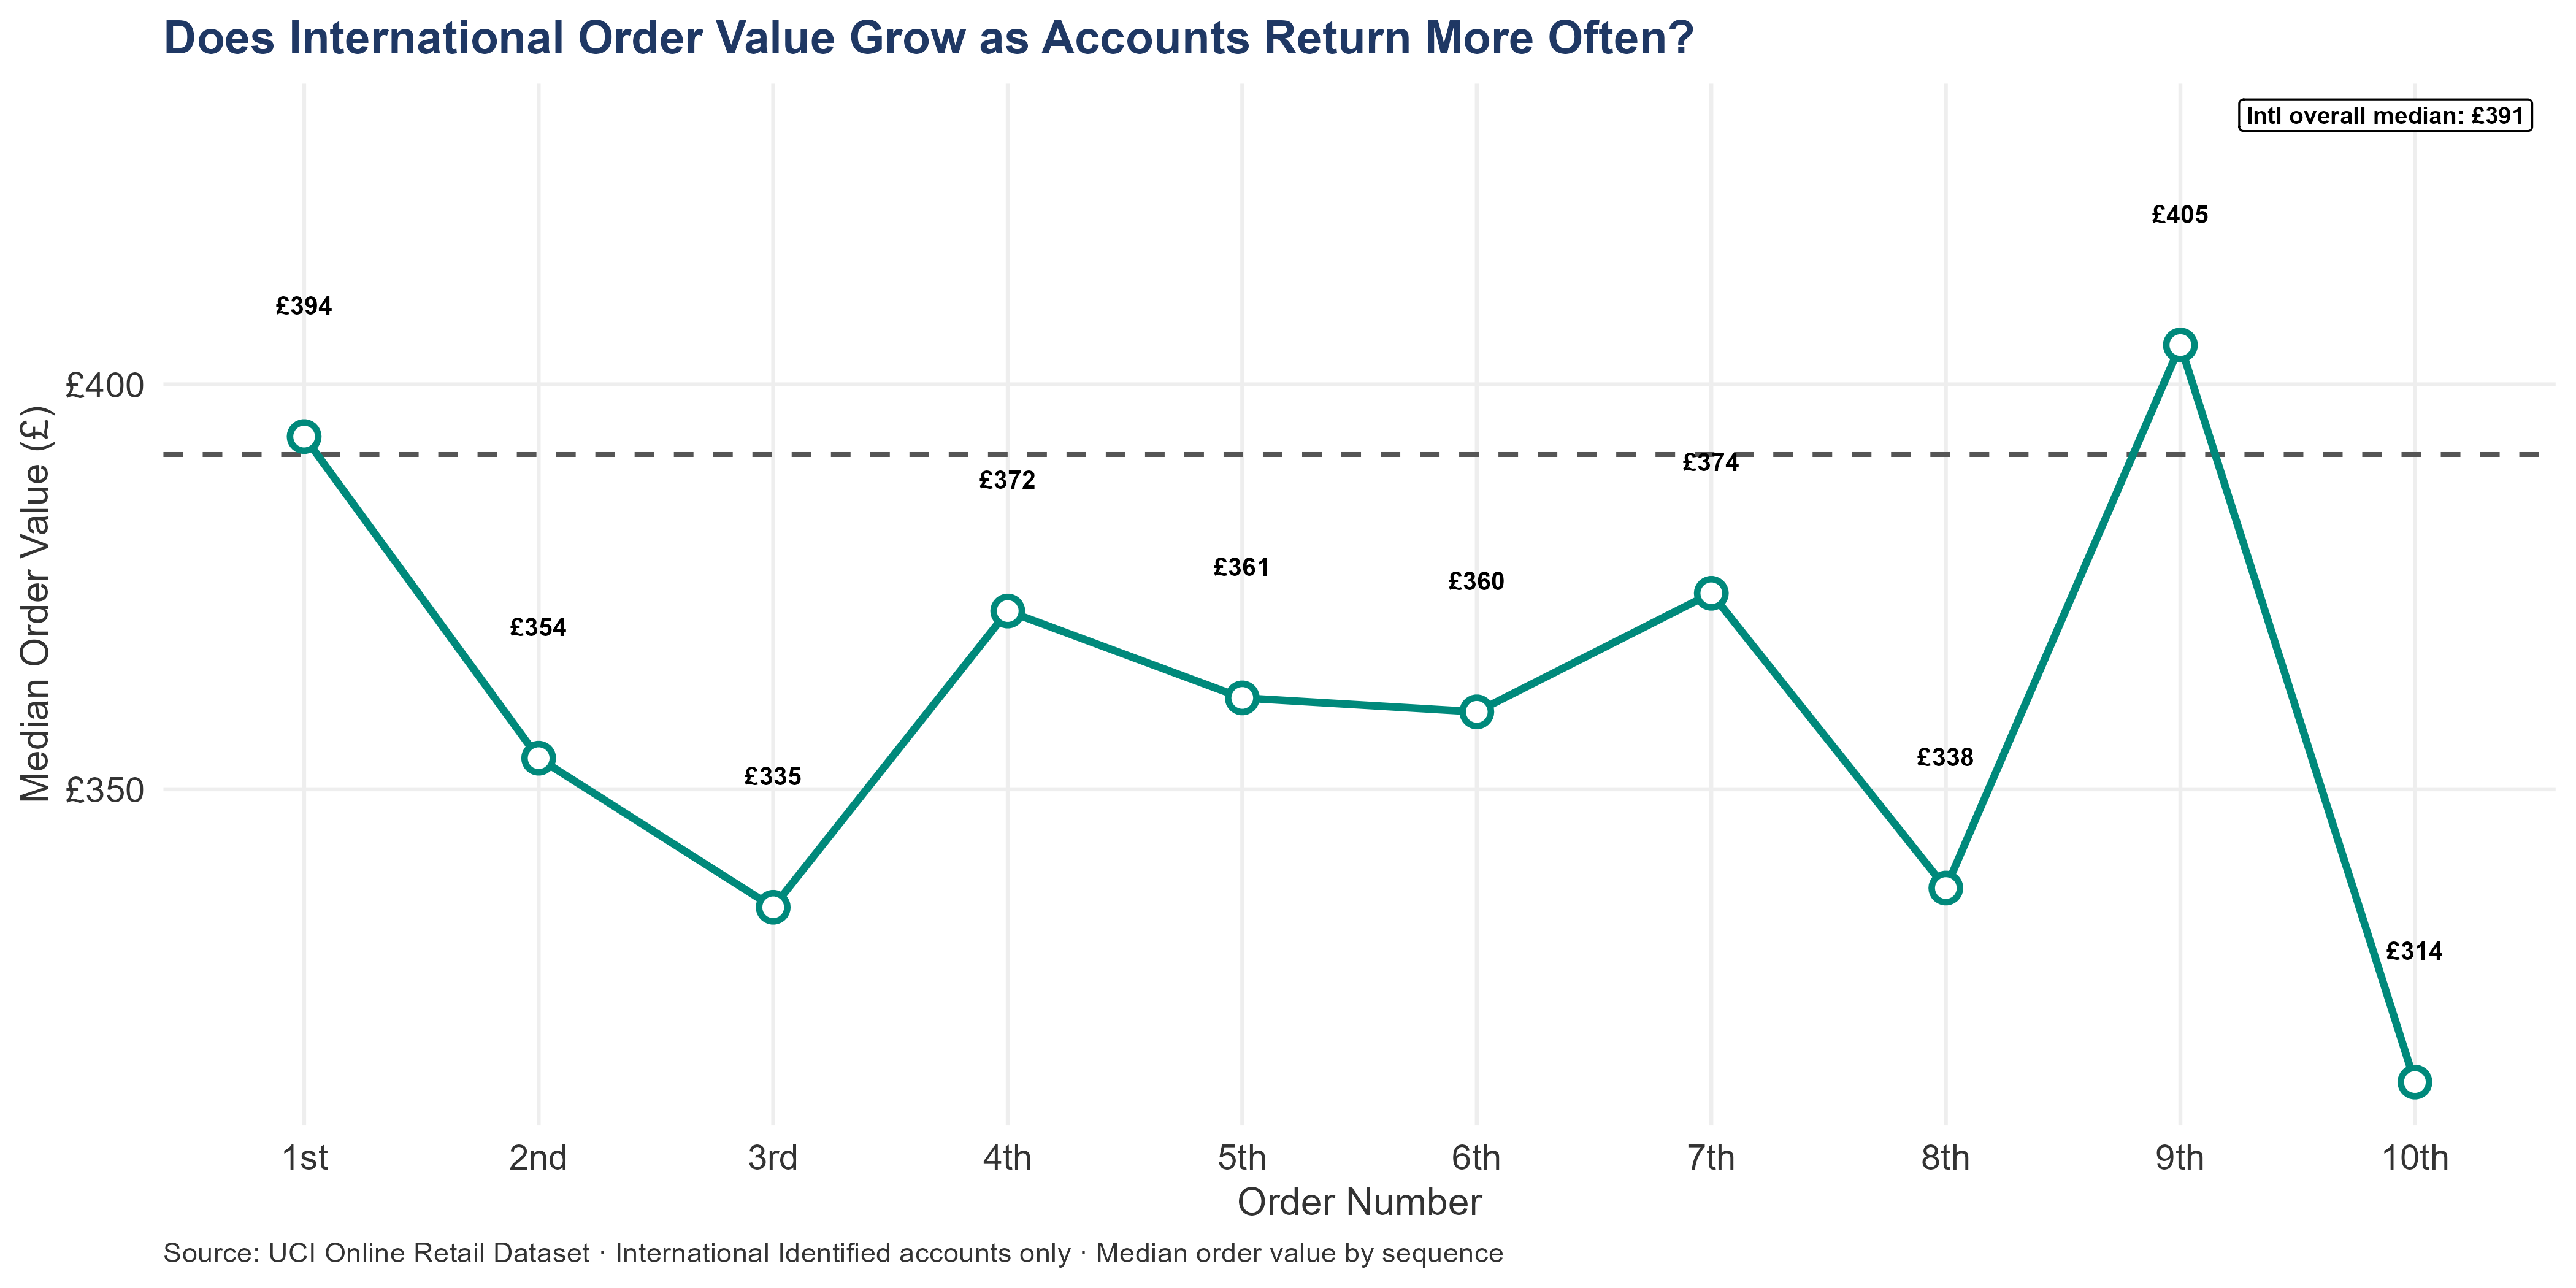
International median order value is flat or declining from the first order to the 10th — £394 on the first order, £314 by order 10, tracking close to the international overall median of £391 throughout. International accounts do not spontaneously increase their spend per visit as the relationship matures; the growth lever is frequency, not basket size. One additional order per international account per year at that median, applied across 414 identified accounts, generates approximately £162.01K in additional annual revenue.
For an acquirer, the financial-modeling implication is the same as for the UK: model international revenue growth on frequency improvement, not basket-size increases — the LTV tables in LTV Portfolio show what each percentage point of retention improvement adds to the forward portfolio, and that is the correct growth lever. Product-affinity cross-sell looks like a basket-size lever but operates through frequency too, and the effect is amplified internationally: an account that adds a second product to a standing order has two independent reorder triggers instead of one, and each additional product improves shipping economics and creates a stronger anchor against competitor substitution in the account’s home market.
8.2 H1 vs H2 Momentum — Account Retention and Attrition
8.2.1 UK Momentum
The UK segment shows clear half-over-half revenue growth. Returning customers drove the increase. But underneath the growth line, a concerning pattern emerges: accounts that were active in H1 and placed zero orders in H2 represent established relationships that broke down.
These are not seasonal pauses. Q4 is the busiest quarter. An account that stopped ordering months before the busiest period did not take a break for the holidays — something changed. The transaction record shows the pattern. Only a conversation with the customer can explain it.
The accounts that matter most. The highest-revenue accounts that went silent between H1 and H2 are the most immediately actionable intelligence in this section. Each has a documented spending history. Each went quiet before peak season. The financial exposure is computable from their historical revenue.
8.2.2 UK Customer Base Trajectory — H1 vs H2
Each UK account is classified by whether its revenue grew, shrank, or disappeared between H1 (January–June) and H2 (July–December) of 2011:
Accelerating — H2 revenue more than 30% above H1. These accounts are not just returning — they are spending more in the second half than the first. In the context of a business where H2 includes Q4, accelerating accounts are likely increasing their seasonal purchasing. This is the most commercially positive signal in the dataset.
New in H2 — First order placed in H2. These accounts have no H1 baseline to compare against. They represent new relationships acquired in the second half of the year. Whether they return in H1 2012 determines whether they become real relationships or one-time accounts who happened to order during Q4.
Stable — H2 revenue within ±30% of H1. Consistent accounts. Not growing or shrinking materially. The segment’s reliable middle — plannable, predictable, and underserved by sales investment that concentrates on the extremes.
Decelerating — H2 revenue more than 30% below H1. These accounts are spending less in the second half than the first. In a business where H2 is the heavier revenue half, decelerating accounts are going against the seasonal grain. This warrants investigation: is it a satisfaction issue, a competitor win, a budget shift, or simply a product assortment mismatch?
Lapsed in H2 — Ordered in H1, zero orders in H2. This is the most urgent category. These accounts were active relationships that went completely silent before Q4. See the dedicated callout below.
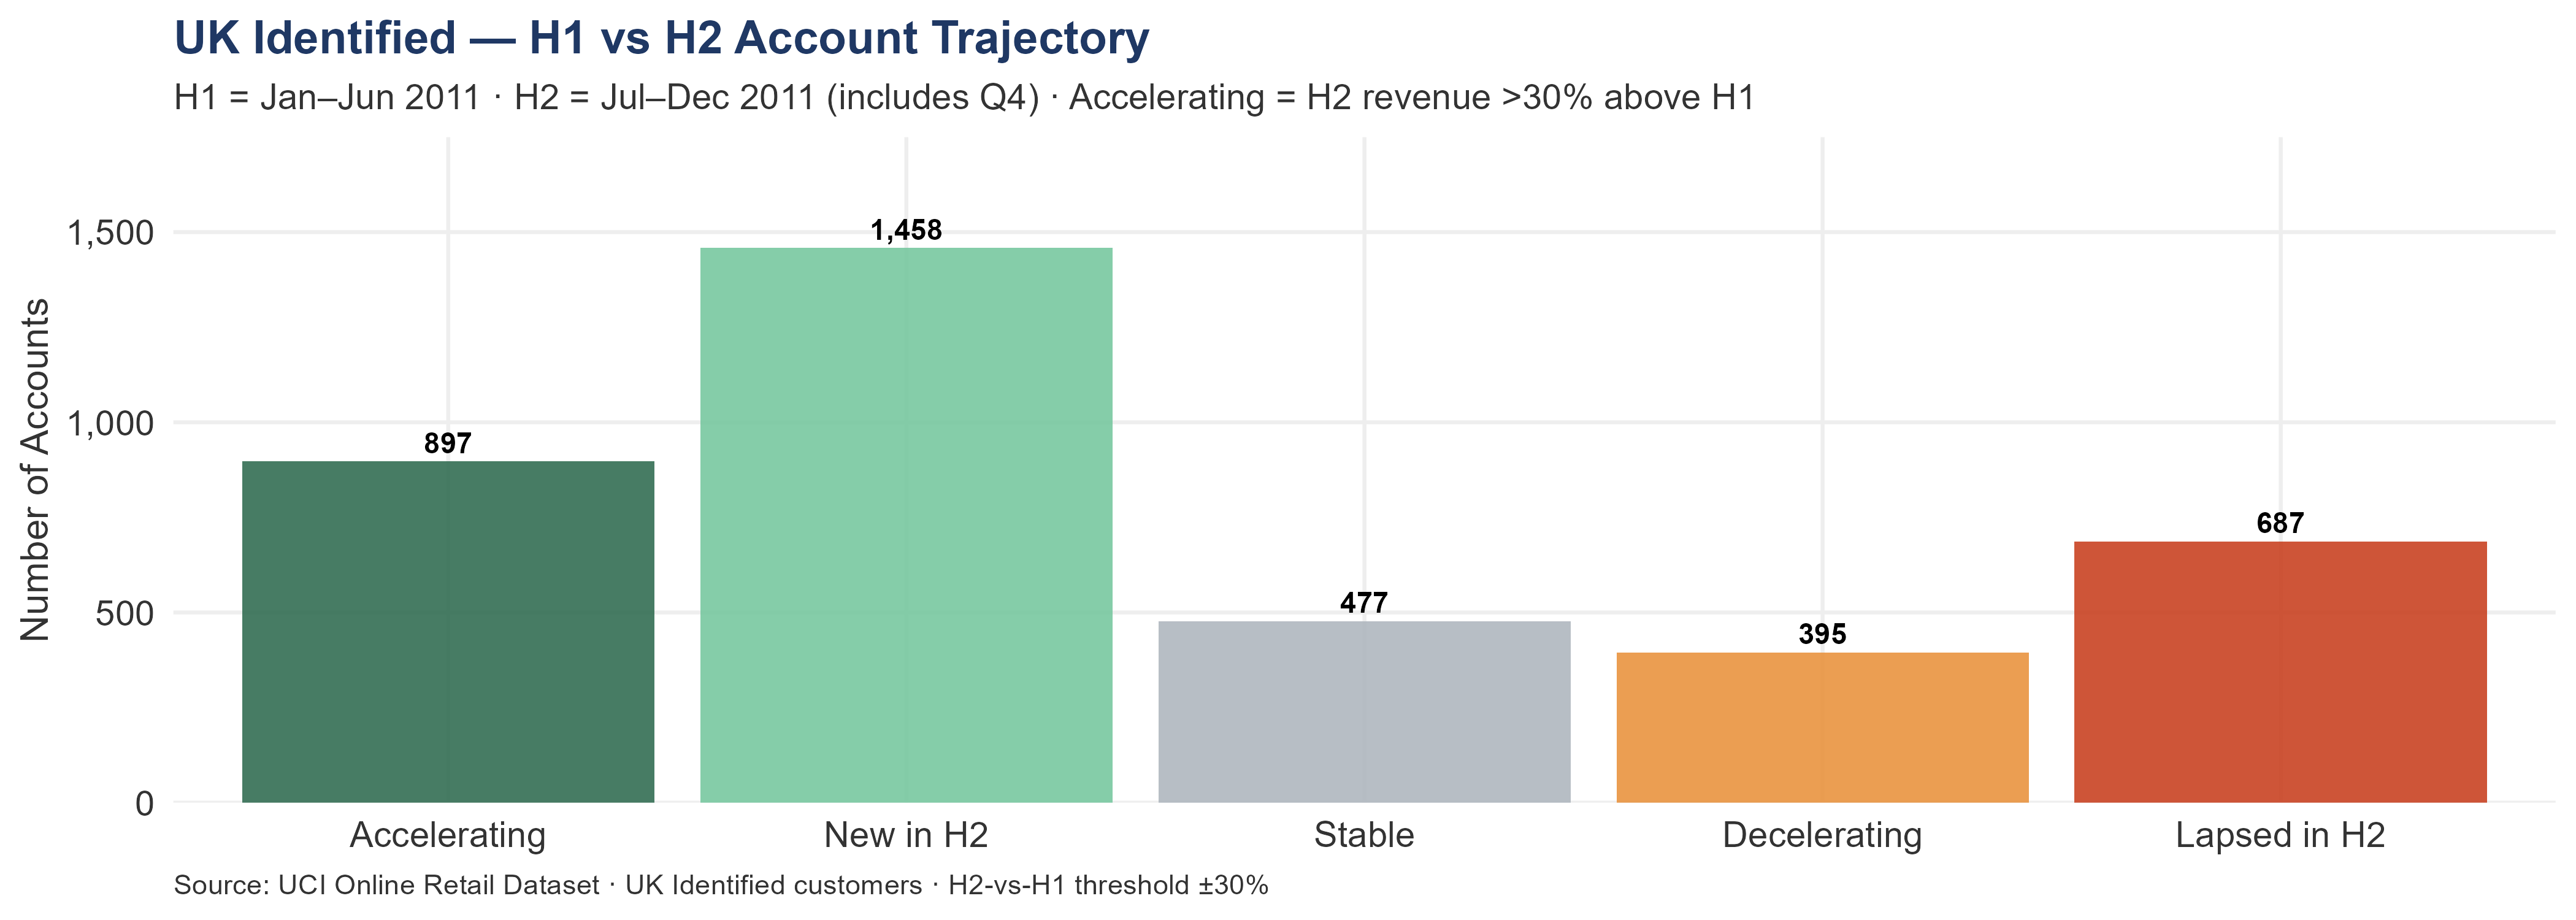
In total, 897 UK accounts accelerated in H2 2011, increasing their revenue by 30% or more relative to H1. Their combined H2 revenue was £2.37M. A further 395 decelerated — spending materially less in H2 than H1. Another 477 were stable within ±30% of their H1 baseline. Meanwhile, 1,458 accounts placed their first order in H2, and 687 that had ordered in H1 placed zero orders in H2.
More accounts are accelerating (897) than decelerating (395). The UK base, in aggregate, is gaining ground from H1 to H2 — a positive structural signal, though it does not offset the 687 relationships that disappeared before Q4 arrived.
The 687 accounts that lapsed in H2 are the most urgent signal in this section. They had an established purchasing pattern in H1 — combined H1 revenue of £353.23K — and then went completely quiet. This did not happen in January or February, when silence might reflect a seasonal pause. It happened in the second half of the year, including the months immediately before Q4. These accounts should have been placing their largest orders of the year. Instead, they placed none. The accounts requiring immediate attention table below identifies the highest-value silent accounts by tier.
The 687 lapsed H2 accounts are zero-acquisition-cost targets: a reactivation call from new ownership simultaneously attempts to restart the commercial relationship and introduces the change of management. At the UK 3-year LTV (approximately £1.24K per retained customer), reactivating 10% of these accounts adds approximately £85.83K to the forward portfolio at outreach cost only — the highest-ROI first-month action available in the UK segment after the overdue Frequent contacts.
8.2.3 Overdue Frequent Accounts
Frequent accounts flagged as overdue represent the highest-value relationships in the portfolio showing early warning signs. At the observed LTV, each account recovered is worth more than an average new acquisition — and costs nothing to acquire because the relationship already exists.
At the UK median reorder interval of 52 days, an account silent for 90 days has missed at least one cycle; 270 days is roughly three. The grouped view below shows the shape of the silent-account exposure — for a DD reader, the question is which tiers carry the documented value and warrant first contact post-close.
| Tier | Account Count | Combined Net Revenue | Median Days Silent | Investigation Priority |
|---|---|---|---|---|
| Frequent (10+) | 7 | £23.39K | 156 | Investigate first — established cadence broken |
| Regular (4–9) | 125 | £192.75K | 127 | Investigate — relationship interruption |
| Occasional (2–3) | 406 | £330.26K | 172 | Reactivation pool — sized for bulk outreach |
| One-timer (1) | 762 | £226.09K | 246 | Conversion campaign cohort |
8.2.4 Lapsed 2010 Accounts
Accounts that ordered in 2010 and placed nothing in 2011 have been silent for an entire year. They are not strangers — each has a completed transaction history with this business. A reactivation conversation starts from a fundamentally warmer position than a cold acquisition, at zero acquisition cost. At a 10% reactivation rate, the three-year portfolio gain is directly computable from observed LTV.
| Tier | Account Count | Combined 2010 Revenue | Reactivation Priority |
|---|---|---|---|
| Frequent (10+) | 1 | £5.39K | Investigate first — highest documented recurring value lost |
| Occasional (2–3) | 7 | £4.22K | Reactivation pool — bulk contact program |
| One-timer (1) | 100 | £26.72K | Cold-cohort campaign — limited reactivation evidence |
108 UK accounts ordered in 2010 but placed no orders in 2011. Combined 2010 revenue: £36.33K. None of this revenue transferred to 2011. The account-level breakdown and investigation rationale are in the UK Customer Landscape chapter; the key point for momentum analysis is that these accounts represent zero-acquisition-cost reactivation opportunities whose forward value is directly computable from observed LTV.
For the International segment:
8.2.5 International Momentum
The international segment shows a concerning cancellation rate trend — the rate moved from 1.51% in H1 to 2.34% in H2, heading directly into peak season. The cause cannot be determined from transaction data. It could be customer-side supply issues, process deterioration, or a change in the account mix. Any of those is material until the seller provides evidence otherwise.
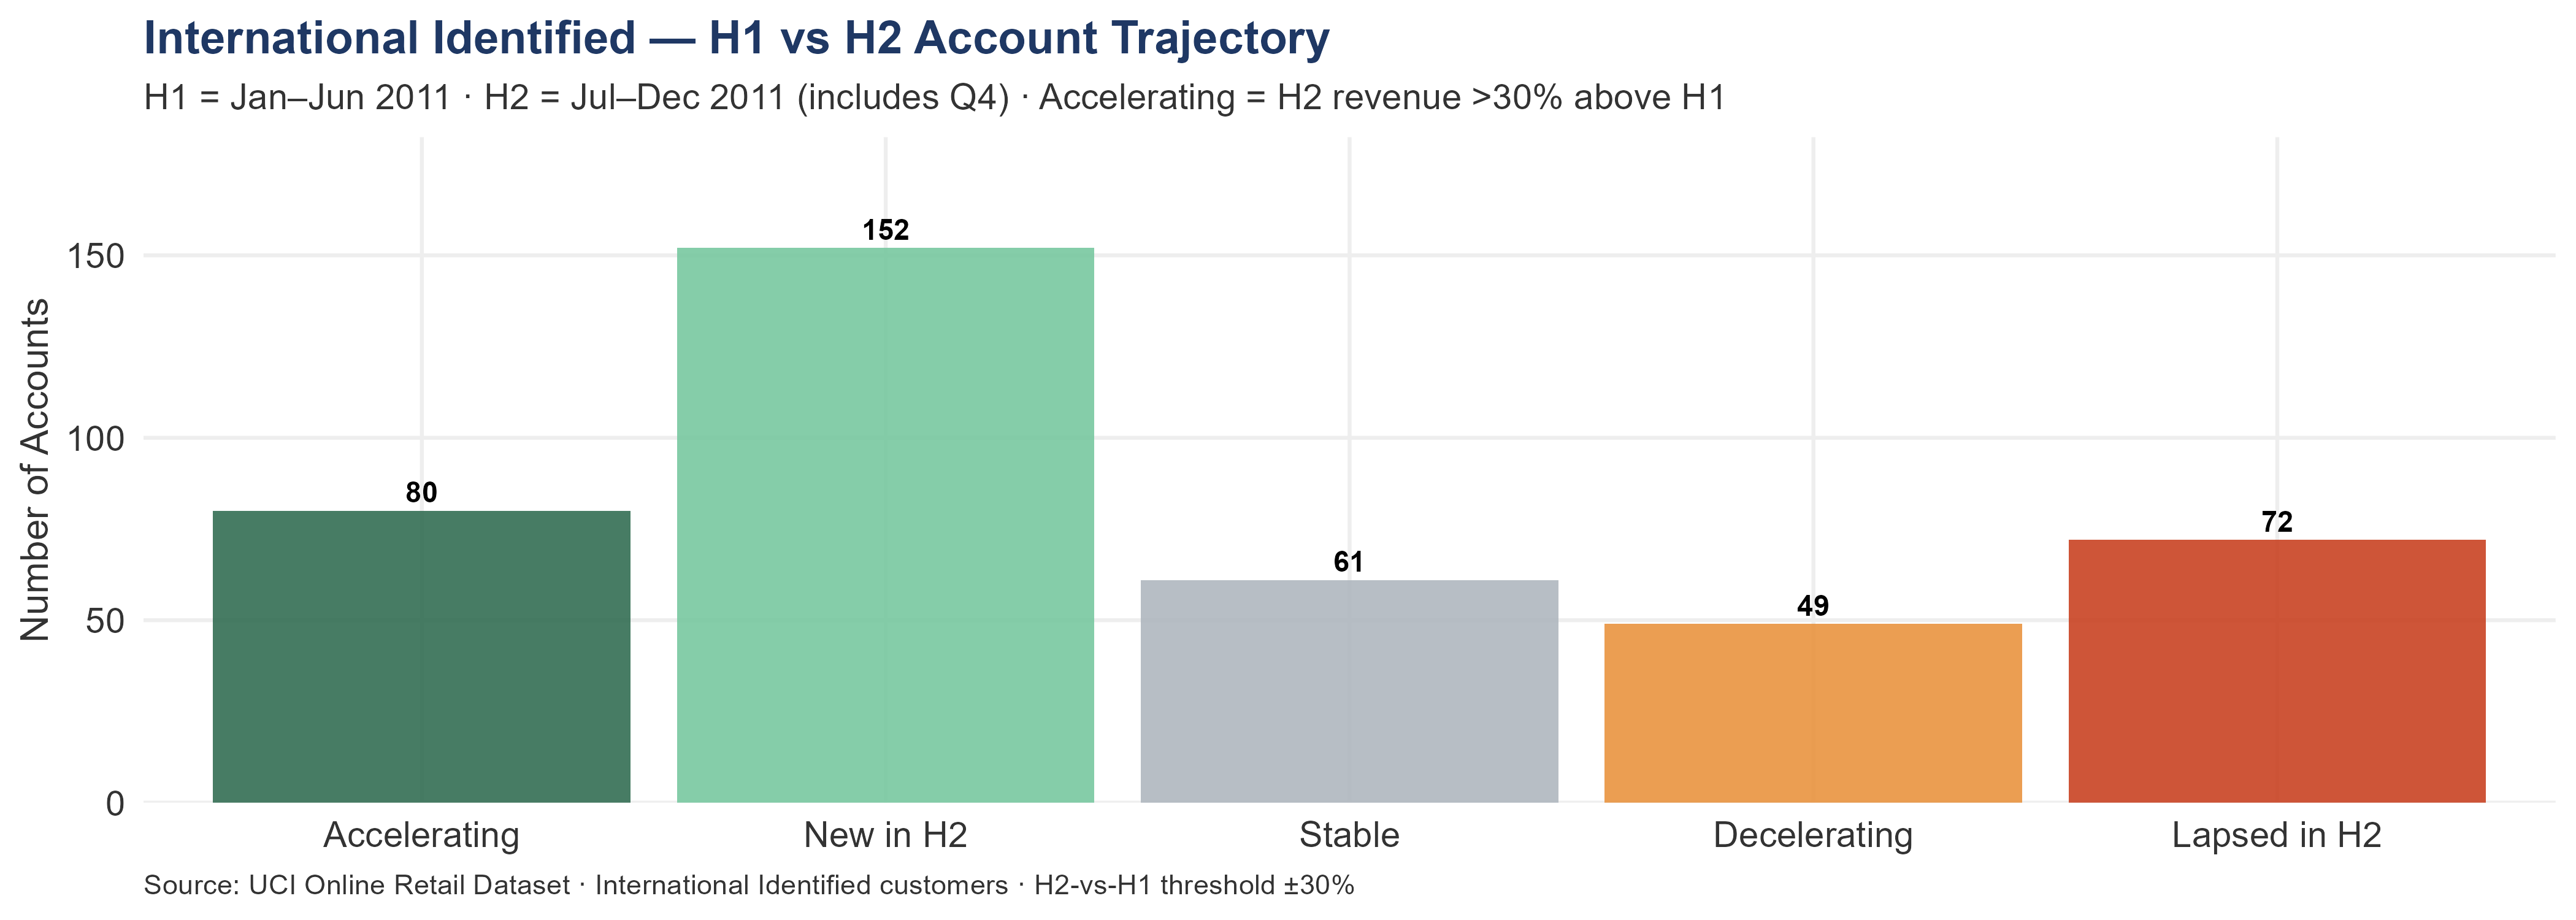
In the international segment, 80 accounts accelerated in H2 2011, increasing their revenue by 30% or more relative to H1. Accelerating accounts are relationships with positive trajectory to protect at close. Their combined H2 revenue was £324.12K versus £144.80K in H1 — a gain of £179.33K. A further 49 decelerated — their combined H2 revenue was £80.48K versus £142.77K in H1 — a loss of £62.30K. Another 61 were stable within ±30% of their H1 baseline. Meanwhile, 152 accounts placed their first international order in H2, and 72 that had ordered in H1 placed zero orders in H2.
More international accounts are accelerating (80) than decelerating (49). The accelerating accounts added £179.33K in incremental H2 revenue. The decelerating accounts lost £62.30K. The international base is net-positive on H1→H2 trajectory — a positive structural signal, though it does not offset the 72 relationships that disappeared before Q4 arrived.
Total revenue at risk from silent and lapsed accounts: £142.34K — the combined H1 revenue of H2-silent accounts (£52.63K), overdue accounts (£85.81K), and lapsed 2010 accounts (£3.91K). This is not theoretical forward value — it is documented revenue from relationships that already exist. The cost of recovering it is an outreach call. The cost of not recovering it is that amount gone permanently.
Whether more accounts are accelerating or decelerating across halves tells the acquirer whether the segment is structurally growing or contracting at the individual account level. Accelerating accounts are relationships with positive commercial trajectory — these are the accounts to protect with named ownership and proactive engagement. Decelerating and lapsed accounts represent recoverable revenue at near-zero acquisition cost: a new owner reaching out to H2-silent accounts simultaneously reactivates a commercial relationship and introduces the change in ownership. The £142.34K revenue at risk from silent and lapsed accounts frames the international reactivation program’s financial case: at 10% reactivation, approximately £14.23K in documented revenue is recoverable at outreach cost only.
Across 24 markets, 72 individual accounts ordered in H1 and placed zero orders in H2.
These are account-level events, not country-level ones: a single market may have lost one account or many. Their combined H1 revenue was £52.63K. The table below shows which markets lost the most accounts in H2, what share of each market’s account base went silent, and what share of that market’s H1 revenue those silent accounts represented. A market losing a high percentage of both its accounts and its H1 revenue may have a market-level cause rather than isolated account-level churn.
| Market | Market Accounts | Accounts Lost in H2 | % of Market Lost | H1 Rev Lost | % of Market H1 Rev |
|---|---|---|---|---|---|
| Germany | 94 | 14 | 14.89% | £17.89K | 21.41% |
| France | 87 | 15 | 17.24% | £4.82K | 6.66% |
| Japan | 8 | 2 | 25.00% | £4.36K | 28.44% |
| Channel Islands | 9 | 2 | 22.22% | £3.38K | 36.53% |
| Greece | 4 | 2 | 50.00% | £3.05K | 85.67% |
| Switzerland | 21 | 3 | 14.29% | £2.37K | 11.60% |
| Austria | 11 | 4 | 36.36% | £2.08K | 69.20% |
| Australia | 9 | 1 | 11.11% | £1.76K | 2.17% |
| Lebanon | 1 | 1 | 100.00% | £1.69K | 100.00% |
| Italy | 14 | 2 | 14.29% | £1.39K | 25.22% |
| Belgium | 25 | 5 | 20.00% | £1.37K | 10.11% |
| Spain | 30 | 3 | 10.00% | £1.30K | 5.73% |
| Portugal | 19 | 3 | 15.79% | £1.21K | 11.96% |
| Brazil | 1 | 1 | 100.00% | £1.14K | 100.00% |
| United Arab Emirates | 2 | 1 | 50.00% | £889 | 100.00% |
| Netherlands | 9 | 2 | 22.22% | £692 | 0.53% |
| Canada | 4 | 2 | 50.00% | £675 | 36.55% |
| Bahrain | 2 | 2 | 100.00% | £548 | 100.00% |
| Cyprus | 8 | 2 | 25.00% | £476 | 6.97% |
| USA | 4 | 1 | 25.00% | £384 | 100.00% |
| Sweden | 8 | 1 | 12.50% | £366 | 2.95% |
| Finland | 12 | 1 | 8.33% | £351 | 4.71% |
| Norway | 10 | 1 | 10.00% | £294 | 4.81% |
| Saudi Arabia | 1 | 1 | 100.00% | £146 | 100.00% |
8.2.6 H1 vs H2 — Country-Level Customer Movement
Country-level ordering patterns between halves identify which markets are growing, which are stable, and which are contracting. H1-to-H2 declines warrant investigation before they compound. Markets showing growth are candidates for increased account management investment.
Retained accounts — ordered in both H1 and H2. These relationships are stable.
| Market | Total Accounts | Retained in H2 | % Retained | Market Revenue |
|---|---|---|---|---|
| Germany | 94 | 42 | 44.68% | £205.38K |
| France | 87 | 42 | 48.28% | £183.99K |
| Spain | 30 | 15 | 50.00% | £55.71K |
| Belgium | 25 | 15 | 60.00% | £36.93K |
| Switzerland | 21 | 9 | 42.86% | £52.44K |
| Australia | 9 | 8 | 88.89% | £138.10K |
| Netherlands | 9 | 5 | 55.56% | £283.89K |
| Sweden | 8 | 4 | 50.00% | £36.83K |
| EIRE | 3 | 3 | 100.00% | £261.89K |
| Japan | 8 | 3 | 37.50% | £37.42K |
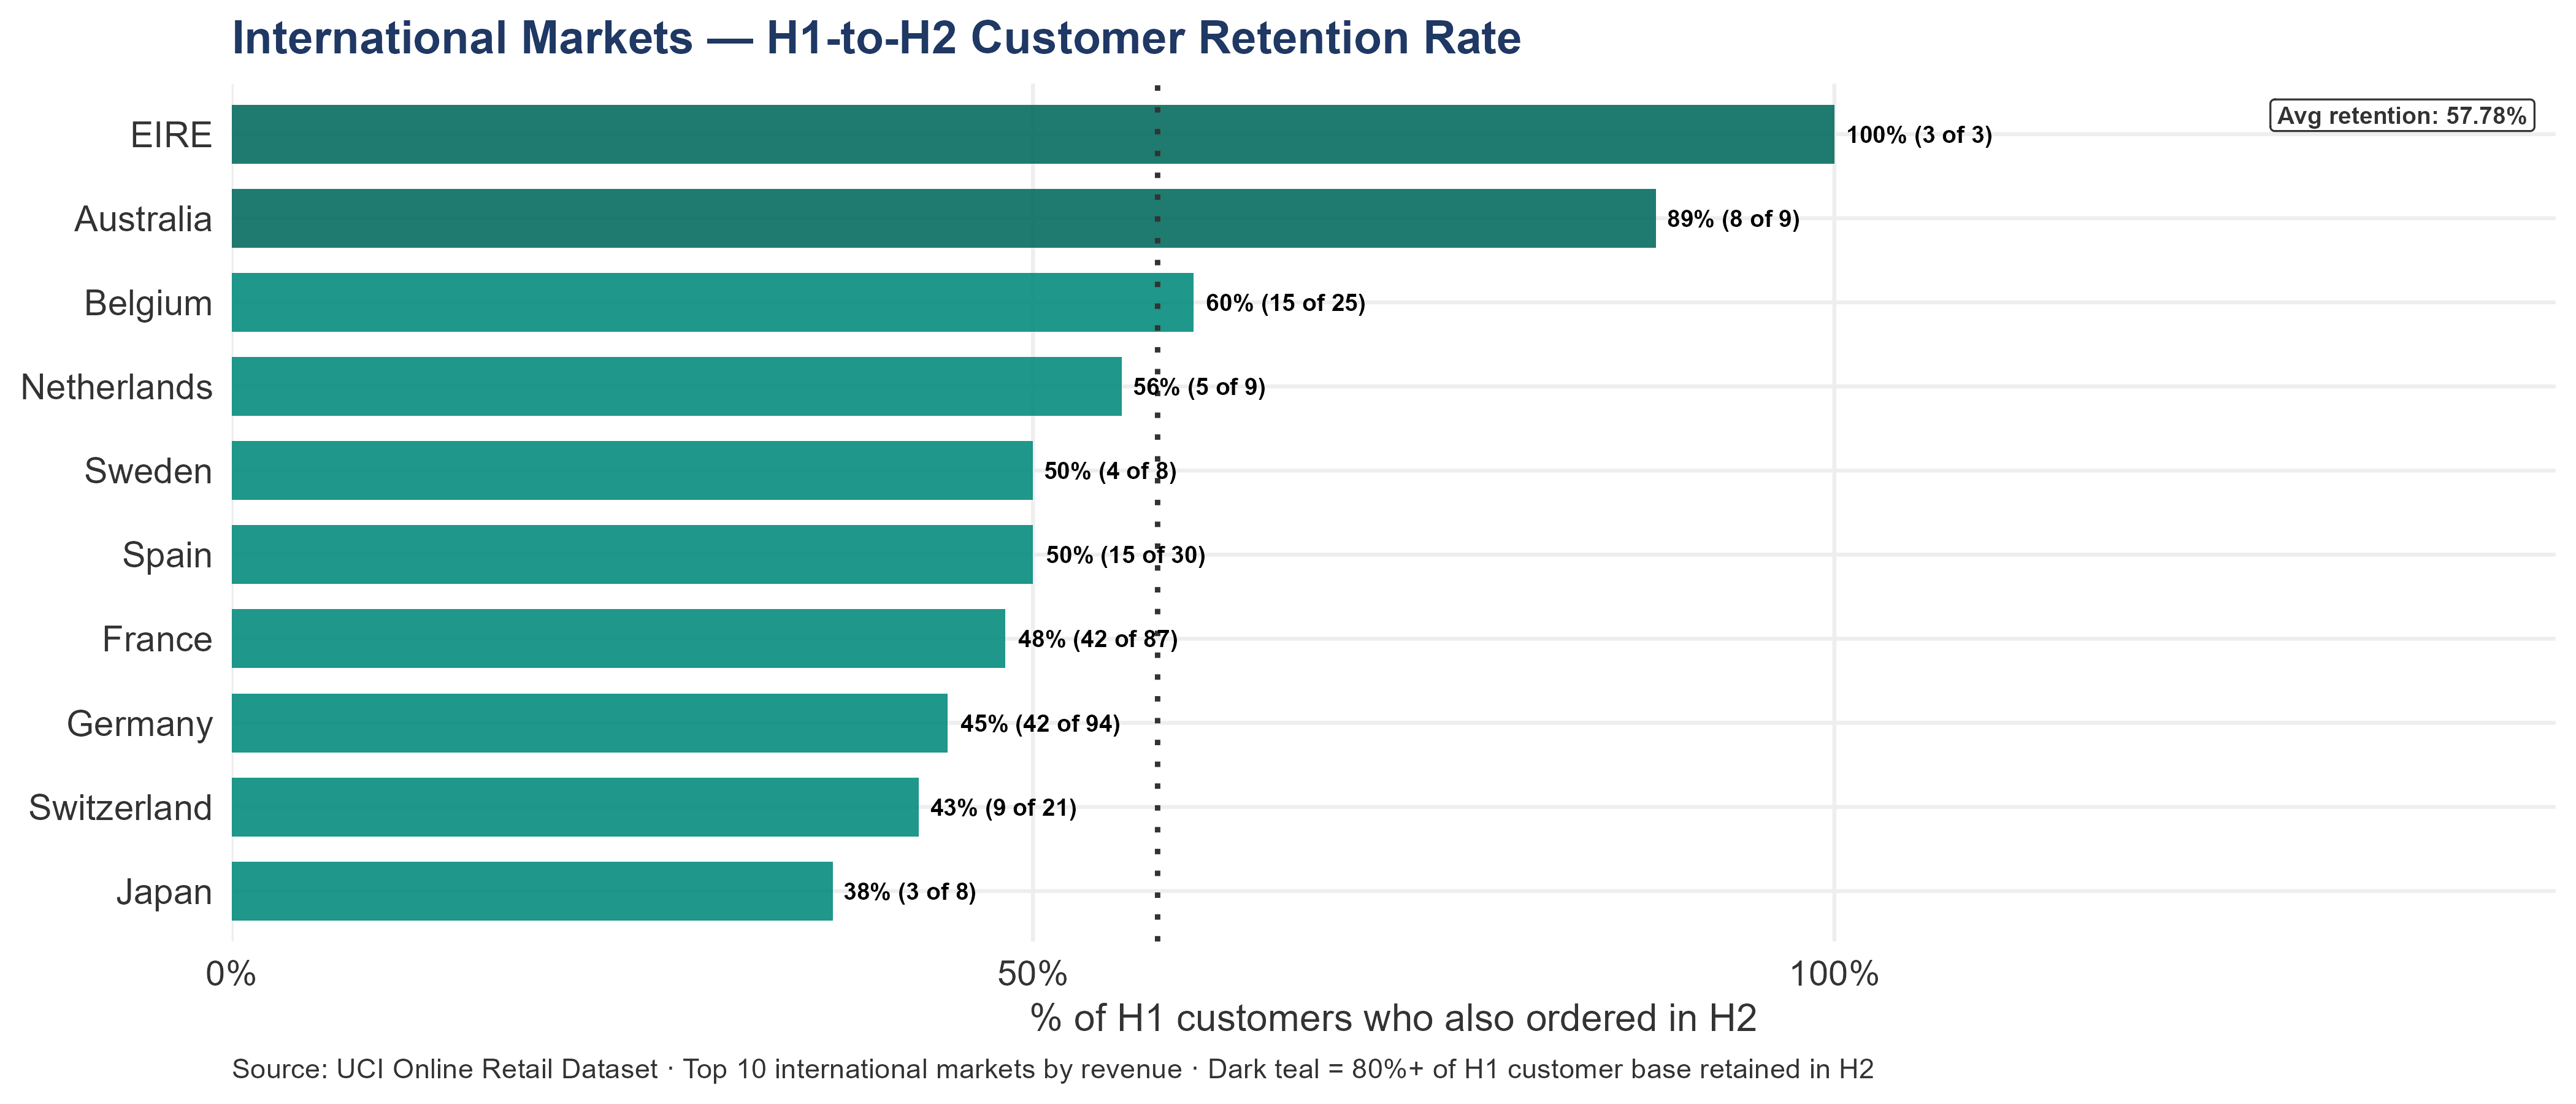
Eire retained 100% of its H1 accounts into H2; Australia retained 88.9% — the two most commercially stable markets in the top 10. Germany and France retained fewer than half their H1 accounts, but the absolute numbers (42 each) are still meaningful given their market size. Retention is not the same as active management: retained accounts still need a contact cadence to stay retained.
Lost in H2 — accounts that ordered in H1 and placed zero orders in H2. The combined H1 revenue from these accounts is the size of the reactivation exposure.
| Market | Accounts Lost | Combined H1 Revenue at Risk |
|---|---|---|
| Germany | 14 | £17.89K |
| France | 15 | £4.82K |
| Japan | 2 | £4.36K |
| Channel Islands | 2 | £3.38K |
| Greece | 2 | £3.05K |
| Switzerland | 3 | £2.37K |
| Austria | 4 | £2.08K |
| Australia | 1 | £1.76K |
| Lebanon | 1 | £1.69K |
| Italy | 2 | £1.39K |
| Belgium | 5 | £1.37K |
| Spain | 3 | £1.30K |
| Portugal | 3 | £1.21K |
| Brazil | 1 | £1.14K |
| United Arab Emirates | 1 | £889 |
| Netherlands | 2 | £692 |
| Canada | 2 | £675 |
| Bahrain | 2 | £548 |
| Cyprus | 2 | £476 |
| USA | 1 | £384 |
| Sweden | 1 | £366 |
| Finland | 1 | £351 |
| Norway | 1 | £294 |
| Saudi Arabia | 1 | £146 |
France and Germany account for the highest counts of lost accounts. Smaller markets where 20%+ of accounts went silent — Japan, Greece — represent a structural signal rather than coincidence. Both lenses warrant separate DD investigation: high-count markets size the reactivation exposure; high-percentage markets point toward market-level causes rather than account-level ones.
Post-close contact should proceed in order of H1 revenue within each market. If multiple accounts in the same market went silent simultaneously, investigate a shared market-level cause before making individual calls.
New in H2 — first international order placed in H2.
| Market | New Accounts (H2) | Combined H2 Revenue |
|---|---|---|
| Germany | 38 | £28.87K |
| Norway | 6 | £22.33K |
| France | 30 | £21.91K |
| Switzerland | 8 | £15.25K |
| Spain | 10 | £7.41K |
| Portugal | 9 | £6.67K |
| Italy | 8 | £5.70K |
| Israel | 2 | £5.01K |
| Finland | 7 | £4.02K |
| Belgium | 3 | £3.93K |
| Austria | 4 | £3.83K |
| Channel Islands | 3 | £3.42K |
| USA | 3 | £3.20K |
| Lithuania | 1 | £1.66K |
| Cyprus | 2 | £1.04K |
| RSA | 1 | £1.00K |
| United Arab Emirates | 1 | £976 |
| Sweden | 3 | £921 |
| Malta | 1 | £906 |
| Denmark | 3 | £891 |
| Japan | 3 | £836 |
| Greece | 1 | £546 |
| Poland | 2 | £362 |
| Netherlands | 2 | £254 |
| Canada | 1 | £52 |
These 152 accounts placed their first international order in H2 2011, led by Germany, France, and Spain. Each is in or past the 30-day conversion window — the period where the conversion-rate evidence elsewhere in this report is strongest. The transaction record shows no structured follow-up. The unrecovered conversion exposure against observed rates should be sized before assigning forward value to this cohort.
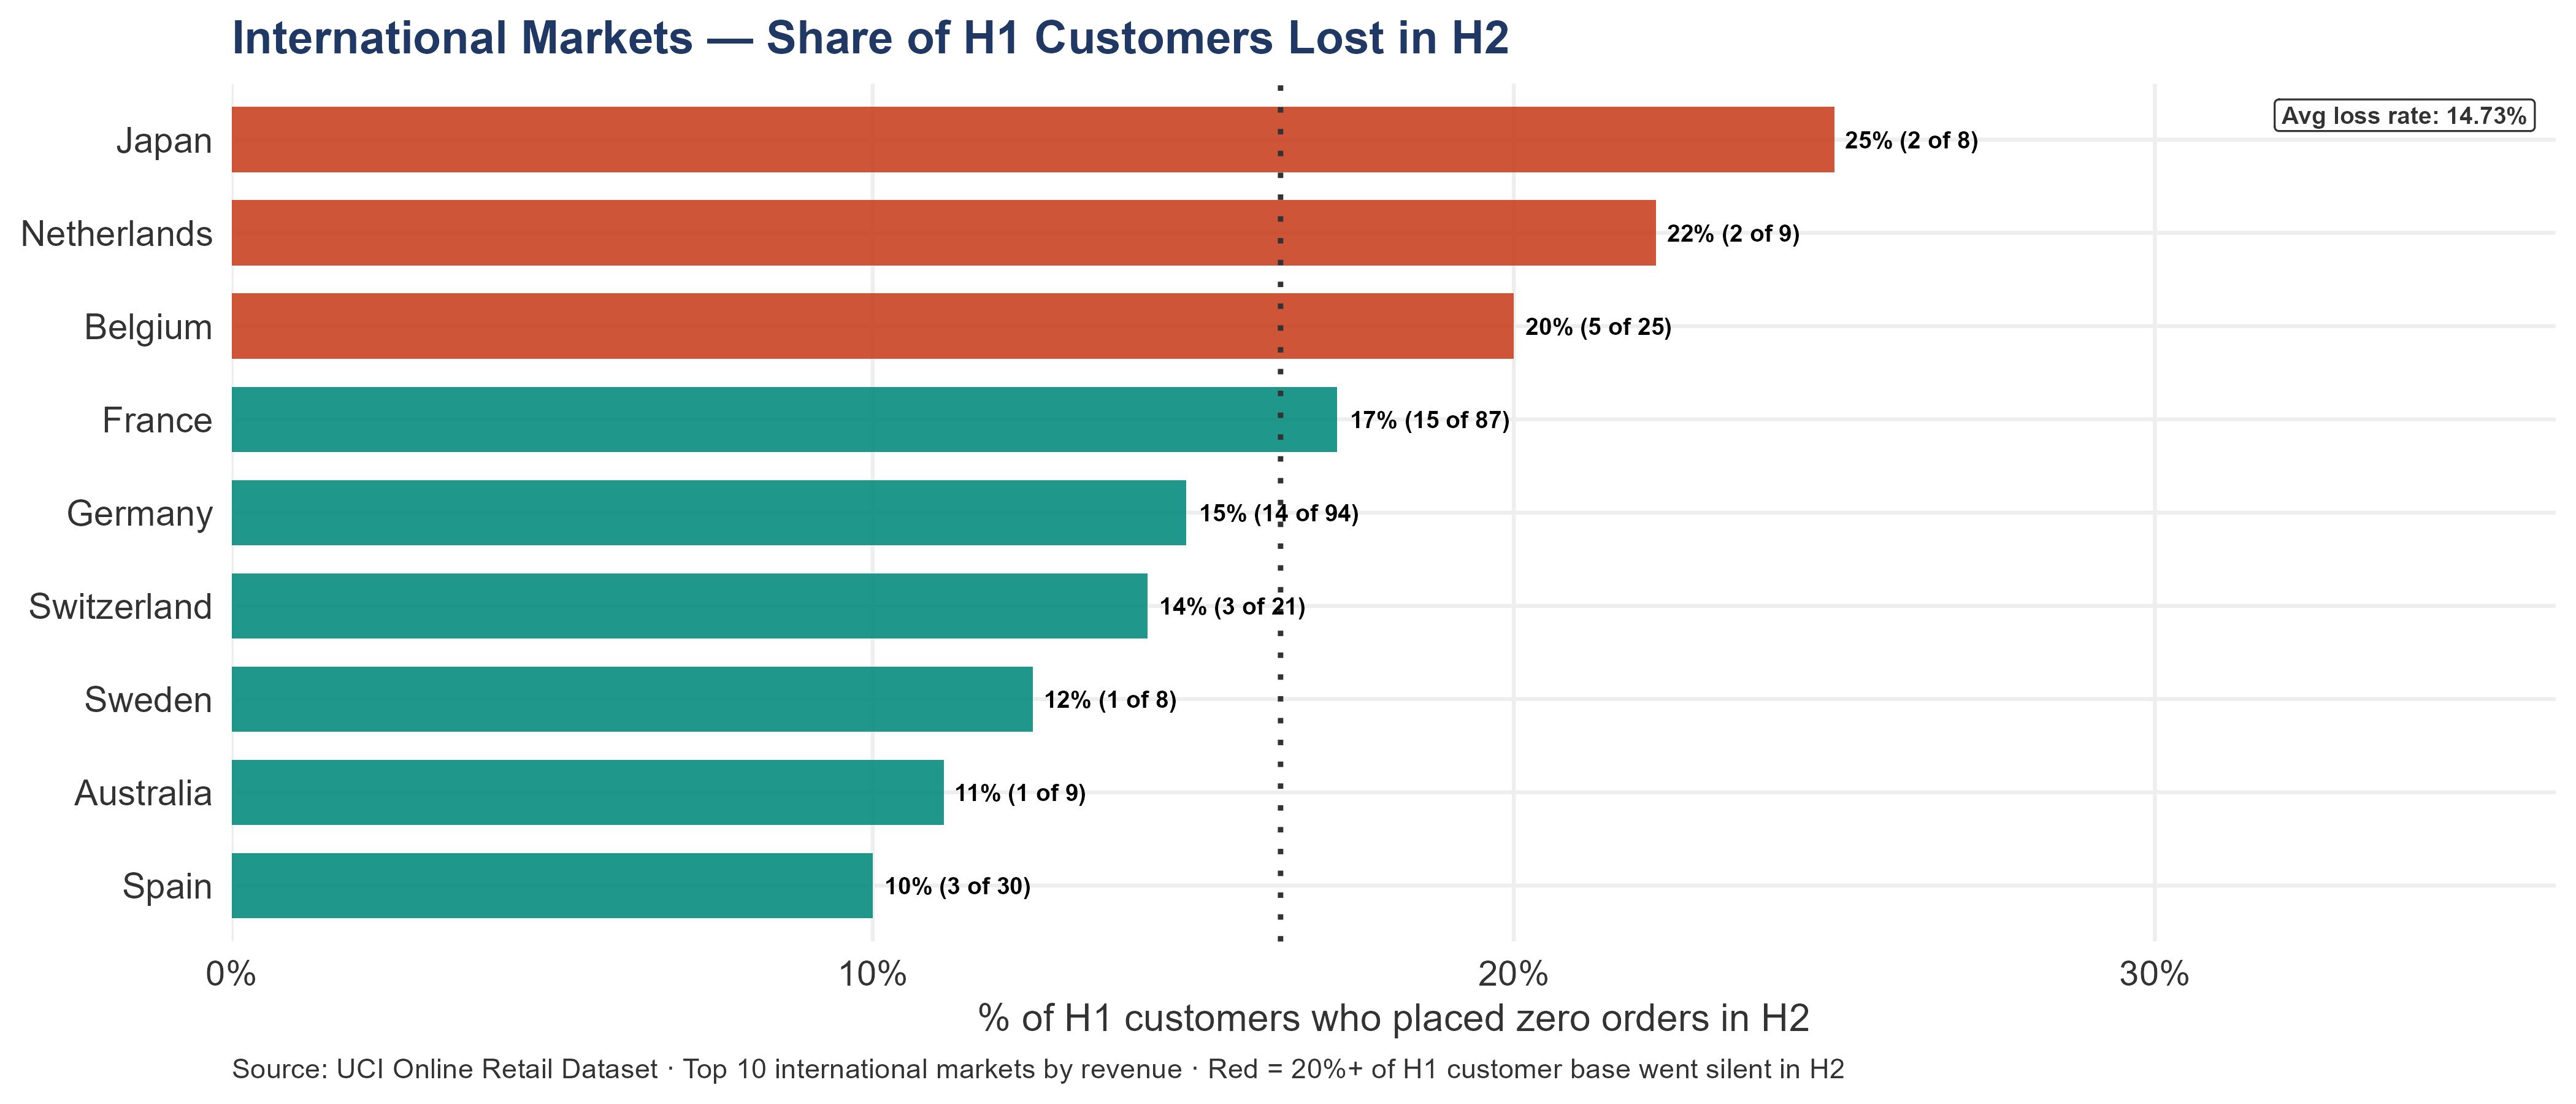
Within the top 10 international markets, the share of H1 customers who went completely silent in H2 varies significantly by country. A high loss rate in a market with only a few customers means the business lost a disproportionate share of that market’s active relationships in one half-year. A low loss rate in a large market means most existing relationships are stable.
Japan had the highest H2 customer loss rate among top-10 markets: 25.00% of its H1 customers (2 of 8) placed zero orders in H2. EIRE had the strongest H1-to-H2 retention: 100.00% of its H1 customers remained active in H2.
8.2.7 International Accounts — Silent Past Personal Reorder Threshold
International accounts with 2+ orders that have gone silent past their personal reorder threshold:
A total of 59 international accounts have gone silent past their individual reorder threshold.
These are accounts with 2 or more orders whose days-since-last-order exceeds their personal 75th-percentile inter-order gap — the point at which, historically, they would have reordered. This is not a population-level threshold; it is calibrated to each account’s own historical cadence. An account flagged here is not simply slow — it is silent in a way that is anomalous relative to its own past history.
| Country | Account Count | Combined Net Revenue | Median Days Overdue |
|---|---|---|---|
| Switzerland | 6 | £19.49K | 70 |
| France | 10 | £16.16K | 40 |
| Germany | 17 | £15.97K | 37 |
| Spain | 5 | £5.35K | 34 |
| Japan | 2 | £5.23K | 195 |
| EIRE | 1 | £4.33K | 86 |
| Belgium | 2 | £2.65K | 96 |
| Canada | 1 | £2.39K | 130 |
| Cyprus | 1 | £2.34K | 6 |
| Portugal | 3 | £1.78K | 238 |
| Lithuania | 1 | £1.66K | 363 |
| Channel Islands | 1 | £1.54K | 92 |
| Poland | 2 | £1.32K | 55 |
| Norway | 1 | £1.26K | 5 |
| European Community | 1 | £1.15K | 96 |
| Denmark | 1 | £1.14K | 19 |
| Greece | 1 | £831 | 57 |
| Austria | 1 | £442 | 152 |
| Australia | 1 | £402 | 308 |
| Finland | 1 | £351 | 188 |
Triage by severity — not all overdue accounts are equally urgent. An account 3x past its personal reorder threshold has been silent three times longer than it has ever waited before. That is categorically different from an account that is just barely overdue.
| Severity | Accounts | Combined Net Rev |
|---|---|---|
| 1x overdue (contact soon) | 28 | £49.75K |
| 2x overdue (urgent) | 9 | £14.90K |
| 3x+ overdue (critical) | 22 | £21.15K |
Where the overdue accounts are concentrated: Germany has the most overdue accounts — 17 accounts (18.09% of its 94 identified accounts) — with combined net revenue of £15.97K. When multiple accounts from the same market go silent simultaneously, the cause may be market-specific rather than account-specific: a local economic event, a competitor entering that market, or a fulfillment or logistics issue affecting all shipments to that country. Before contacting individual accounts, check whether there is a market-level explanation that changes the outreach message.
8.2.8 Lapsed Accounts — Active in 2010, Silent in 2011
International accounts that ordered in 2010 and placed nothing in 2011 represent the segment’s dormant reactivation pool — each with a completed transaction history and zero acquisition cost to re-engage.
A small group — 12 international accounts — ordered in 2010 and placed zero orders in 2011. Combined revenue: £3.91K. These accounts have a documented transaction history with the business. A reactivation conversation starts from a categorically warmer position than new acquisition outreach — and at zero acquisition cost.
| Country | Account Count | Combined Net Revenue |
|---|---|---|
| Lithuania | 1 | £1.66K |
| Italy | 2 | £650 |
| Portugal | 2 | £416 |
| Channel Islands | 1 | £364 |
| France | 3 | £337 |
| Netherlands | 1 | £178 |
| Spain | 1 | £168 |
| Germany | 1 | £137 |
Exchange rate exposure. Every international transaction in this dataset is denominated in British pounds. The customer’s local purchasing power — what the same goods cost in their home currency — is invisible in the data but material to their buying decisions. A price that was competitive in January may not be competitive in November if the pound has strengthened. The business cannot control exchange rates. But it can avoid misdiagnosing an exchange-rate-driven demand shift as a relationship failure — and that misdiagnosis leads to wasted effort and missed pricing adjustments.
Author: Shawn Phillips | Lailara LLC
← Conversion Windows & Reorder Intervals | Lifetime Value Model — Methodology →